Using machine learning to predict water levels at Elephant Butte
New Mexico's flagship lake has been low for decades - I utilize machine learning tools to understand the issue better.

Climate change is making the future of water more uncertain in New Mexico. New Mexico is a semi-arid desert with the smallest amount of freshwater as a percentage of surface area out of all 50 US states (USGS, 2024). The main water feature in the state is the Rio Grande, which starts in the high mountains of Southern Colorado, meanders through the center of New Mexico from the North to the South, and becomes the defining border between Texas and Mexico until it reaches the Gulf of Mexico. All along the Rio Grande, people have been dependent on the river as their primary source of water for thousands of years. The future of the river is in question as the climate changes and water extraction from the river and local groundwater exceed replacement rates (RGISC, 2024).
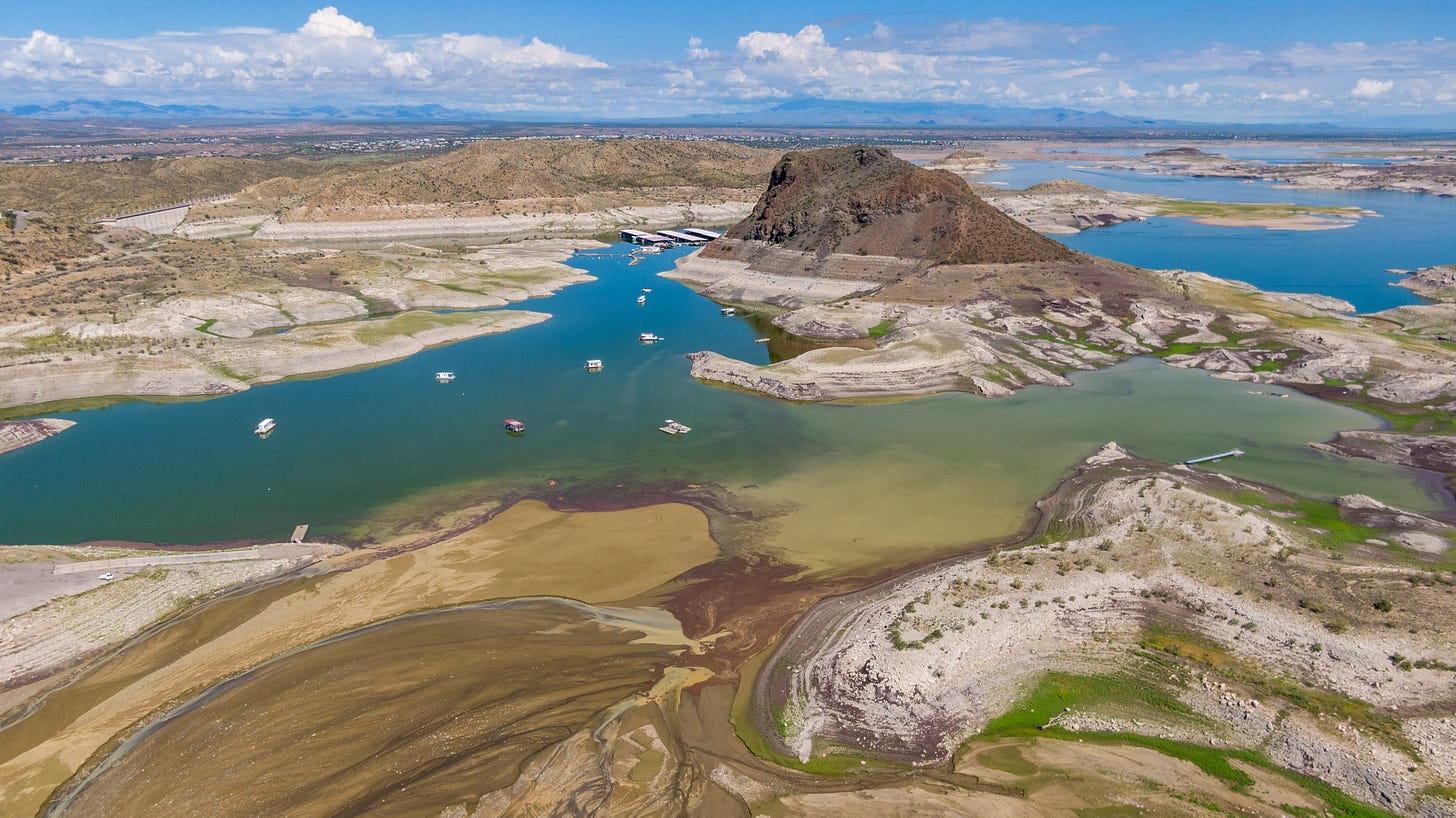
The river’s vulnerability is evident when you analyze the decreasing water levels of the man-made reservoirs along the Rio Grande. The largest reservoir is the Elephant Butte Reservoir in South-Central New Mexico. Elephant Butte Dam was completed in 1916, and at the time of construction, was the second largest of its kind in the world (Briseno, 2020). The dam provides renewable electricity to Southern New Mexico and several neighboring states. Elephant Butte is also the largest lake in New Mexico where people recreate. The main reason water is released is for irrigation in downstream areas (Phillips, 2020). The water level of the reservoir has varied greatly over time but has not been above 35 percent full for decades, as seen in Figure 1.
This project is an attempt to understand the variables that affect the water level of the Elephant Butte Reservoir and test relevant variables’ predicting capabilities using regression and machine learning techniques. The water level of the reservoir is affected by many factors - local drought, snow melt in Southern Colorado, evaporation, changing water laws, and groundwater extraction, to name a few. Furthermore, ongoing lawsuits between Texas and New Mexico underline the urgency of the issue as each state fights for water security (Blanco, 2024). Elephant Butte’s water level is determined by a complex system that is not fully explained with the models presented in this project, but evidence is presented that could guide policymakers to make informed decisions regarding sustainable water use.
Data
To analyze the fluctuating water level at Elephant Butte Reservoir, I utilized data from the United States Geological Survey (USGS), Water Data for Texas, Colorado State University (CSU), and The National Oceanic and Atmospheric Administration (NOAA). The dependent variable is the Elephant Butte reservoir's average monthly water level.
Groundwater levels and precipitation in Las Cruces, New Mexico, from USGS, were analyzed to capture the effect of the local agriculture industry, well water extraction, and the health of the local water table. Las Cruces, located in Dona Ana County, is the first significant city downstream from Elephant Butte Reservoir. Dona Ana County is the most productive pecan-growing region in the United States. Pecan trees are notoriously water-intensive, helping drive the agriculture industry in the state responsible for 76 percent of total withdrawals in the State of New Mexico. Sufficient data on water use and pecan production in New Mexico is lacking, but groundwater levels are shown to be directly tied to local uses, and the health of nearby rivers and streams (NMOSE, 2019).
Historical weather patterns were also captured in this analysis. Sierra County monthly temperature data was analyzed to capture possible effects of evaporation at Elephant Butte. Other data collected near Elephant Butte Reservoir include the flow rate of the Rio Grande above and below the reservoir. San Acacia is one of the last USGS stations measuring the flow rate of the Rio Grande before it gets to Elephant Butte. Once the water reaches San Acacia, it can no longer be diverted to Acequias for irrigation, as it is throughout Central and Northern New Mexico (Phillips, 2005).
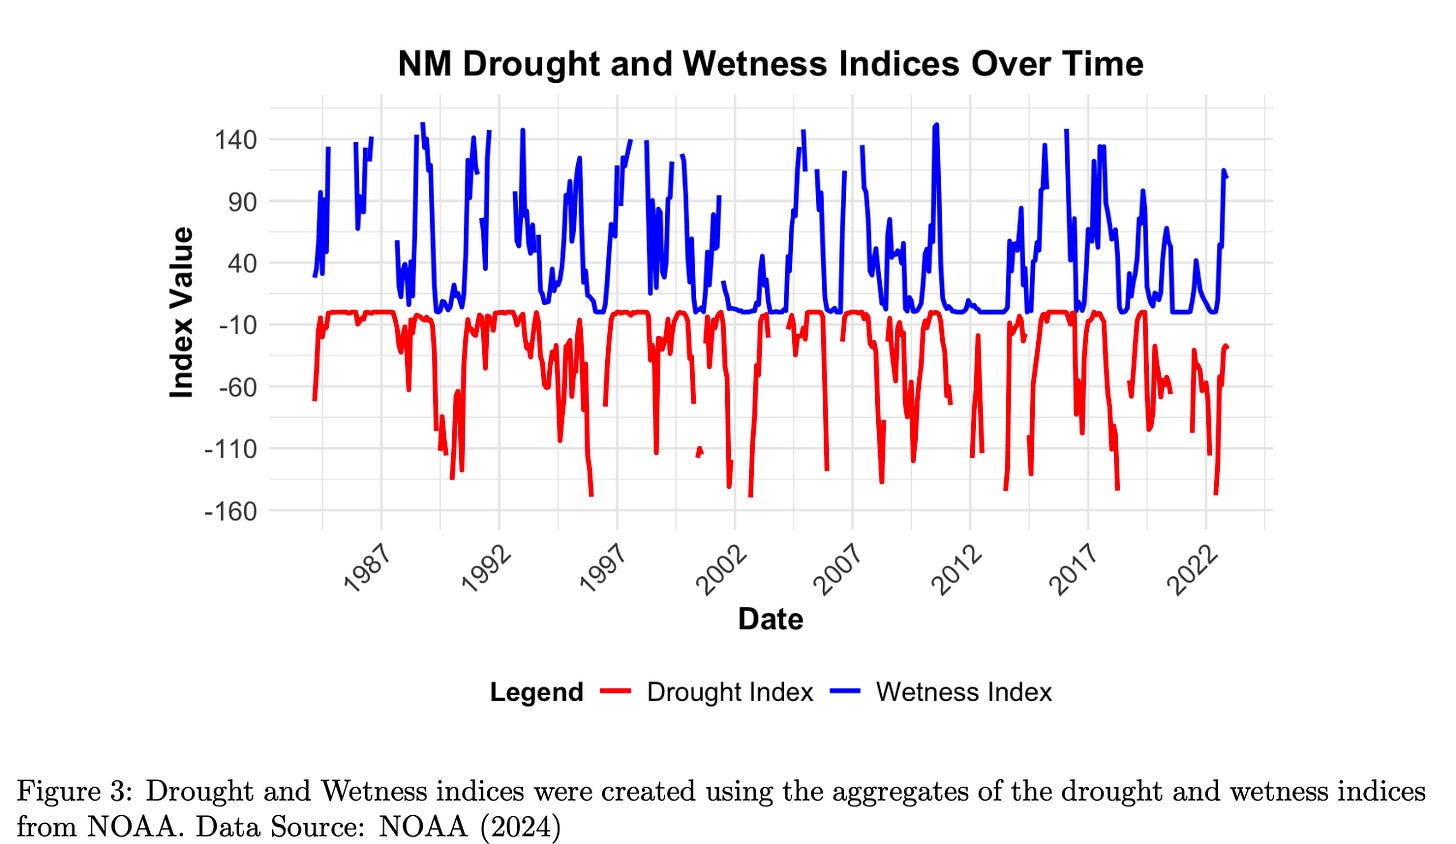
Drought and wetness indices were captured to help further explain the water demand of farmers in Southern New Mexico and the water supply for the upper Rio Grande basin. These variables were captured from drought.gov. These two variables could be seen as inverses of each other, and they largely are, but not always. An absence of drought does not always mean there is moisture, and vice versa.
Further upstream, snowfall data from Wolf Creek Ski area in the San Juan mountains of Southern Colorado was analyzed to help represent the significant contribution of water Elephant Butte receives from snow melt every spring.
Other relevant data is sure to be missing from this analysis regarding Rio Grande water sharing (and fighting) between New Mexico, Colorado, Texas, and Mexico. Ongoing lawsuits between New Mexico and Texas highlight the obvious struggle for water rights between the states, and future prediction models should attempt to capture that complexity.
Data Cleaning
Several missing observations had to be accounted for in this analysis. Each variable has a varying level of completeness, which limited the timeline analyzed and, ultimately, the variables that were used.
First, the Wolf Creek snowfall data ended in 2001, and similar data was difficult to attain. Nevertheless, an analysis of the explanatory power of this variable was conducted, and for reasons explained in the next section of this paper, the Wolf Creek snowfall data was omitted from all of the prediction models.
Second, there was an observation missing for October 2016 in the San Acacia flow rate data. To compensate for this, an observation was created by replacing the NA with the average of all other October observations in the dataset.
Third, the data set on groundwater levels in Las Cruces, NM had gaps that were replaced with best estimates. There were 18 sporadic months missing in the 1980s, 1990s, and 2000s, and a significant gap from March 2011 to December 2022. All of these missing variables were filled using spline interpolation - which effectively estimates the trend line between available data points (see Figure 2).
Feature Engineering
Two sets of variables were created to help improve the predicting capabilities of the models: 10 snowfall lags and 11 monthly dummies; and the drought and wetness indices were constructed using the spectrum of drought and wetness indexes provided by NOAA on drought.gov. The NOAA provides indices of drought severity in a spectrum of D0:D4 and wetness severity in W0:W4. For the purpose of this prediction exercise, these two spectrums were aggregated to capture the severity of each index in simpler form.
The Wolf Creek Snowfall data was meant to help capture the seasonal effect of snow melt coming from Southern Colorado and Northern New Mexico into the reservoir. While the literature shows more snow in the upper Rio Grande Basin leads to a fuller Elephant Butte reservoir, it is difficult to know when this snow melts and makes its way past San Acacia. Therefore, 10 lags were created in an attempt to see how long it took to see a positive correlation between snow in Wolf Creek and water increase in Elephant Butte. After trying several variations of regressions using the lags, the results were inconsistent and statistically insignificant. It’s likely that more data is needed regarding snowfall in the Upper Rio Grande Basin and its lagged effect on water levels in Southern New Mexico. These lags were not included in the final iterations of the models, but the Wetness index likely serves as a decent substitute as it captures moisture in the New Mexican region of the Rio Grande Basin.
In the initial regression analyses, the date variable was included. The coefficient for the date variable was statistically significant at the 1 percent level, leading to an extremely high r-squared of 0.99 in many of the models. This was likely due to the time period analyzed (1984-2022) and the downward trend line apparent in the water level during this time period. This would likely cause out-of-sample prediction errors and extreme over-fitting, therefore the date variable was excluded from the models.
To replace the date variable, 11 monthly dummy variables were created to capture the seasonality of the water level in the reservoir, leaving the twelfth month as the base. This allowed the model to capture the passage of time without influencing the model with misleading trend lines. Furthermore, the monthly dummies help replace the effect of lagged monthly snow melt from Southern Colorado that was difficult to interpret with the snowfall data and help capture irrigation seasonality in Southern New Mexico.
Methodology and Results
Seven prediction models were compared to find the most appropriate way to predict water levels in the Elephant Butte Reservoir: linear regression; LASSO, RIDGE, and Elastic Net Regressions; k Nearest Neighbors (kNN); Random Forests; and a Classification and Regression Tree (CART). First, we will review the results that were common among all of the models, then we will analyze the differences among them.
All of the models found that the most important explanatory variable, of the ones analyzed, is the groundwater levels in Las Cruces. In a model where Las Cruces groundwater is the only explanatory variable, the r-squared is 0.669 - meaning the Las Cruces groundwater levels alone can explain roughly 66.9 percent of the change in water levels in the Elephant Butte reservoir.
As with the rest of the models, the linear regression results in Table 1 show statistical significance for the San Acacia Flow Rate and the drought index, yet the largest coefficient and t-value comes from Las Cruces groundwater. The negative coefficient of -3.16 says that for every foot deeper below the surface groundwater is, the water level of the Elephant Butte reservoir is lower by 3.16 feet, give or take 0.11 ft (Std. Error).
Predictions
Linear Regression, LASSO, RIDGE, and Elastic Net
The linear, LASSO, RIDGE, and Elastic Net regressions all give similar predictions as seen in Figures a, b, c, and d. The relative Root Mean Squared Errors (rRMSE), or the average deviation from the actual water levels as a proportion of the total range, for these four regressions, are 0.165 for the linear regression, 0.169 for LASSO, 0.166 for RIDGE, and 0.166 for Elastic Net. This result is expected all of the regressions operate in similar ways. The important information taken from these regressions is the variables that could be dropped to improve the overall fit of the models.
The Elastic Net model coefficients revealed several variables that have little to no predicting capabilities: Sierra County temperature, Dona Ana County precipitation, and several monthly dummies. Figure 4 illustrates how several coefficients were driven to zero by the Elastic Net model and deemed less important. Sierra County temperature is insignificant likely due to co-linearity with the monthly dummies. Still, this is surprising as much of the literature regards evaporation as a contributing factor to water level loss in the reservoir, but it’s possible another variable exists that can better account for evaporation.
kNN, Random Forest, and CART
The k Nearest Neighbors (kNN), Random Forest, and Categorization and Regression Tree (CART) models were all performed with a 70/30 randomized split of the training and testing data. The results of each of the models vary as follows:
The kNN predictions (Figure e) had a relative RMSE of 23.5 percent and an r-squared of 0.51, making this the worst-performing model in this exercise. This is not completely surprising given the variables used to train the model. As seen in Figure e, kNN had a hard time predicting the sudden drop in water levels during the early 2000s and was sensitive to less important variables. The Random Forest and CART models, on the other hand, were capable of highlighting the importance of the strongest variables, such as Las Cruces groundwater.
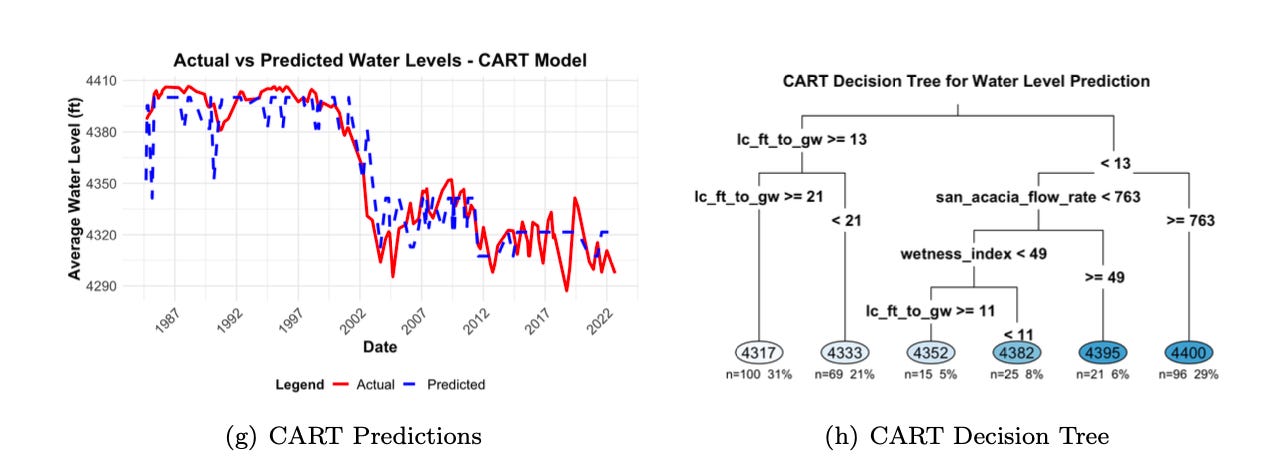
The Random Forest model had a relative RMSE of 12.1 percent and an r-squared of 0.86. Figure f illustrates the strong predicting capabilities of this model. This model was only outperformed by the CART model, which had a relative RMSE of 11.8 percent and an r-squared of 0.87.
The CART model was tuned with a 15 minsplit and 0.075 complexity parameter. More complexity than this didn’t produce much more predicting capabilities in trial. Despite being more of a categorization tool, CART succeeded likely due to the existence of strong predictor variables. As seen in Figure g, CART’s predictions have less movement compared to the other models, illustrating its categorizing nature. The CART decision tree (Figure h) gave decision-making power mostly to Las Cruces groundwater - where all predictions were made using this variable when groundwater was greater than or equal to 13 feet below the surface. The only other two decision-making variables in this model were the San Acacia flow rate and the state wetness index.
Conclusion
Many of the variables explored during this prediction exercise held little to not predicting power, but by using just a few key variables, strong predictions were possible. The CART model gave the most reliable predictions using the following variables: Las Cruces groundwater levels, Rio Grande flow rate at San Acacia, and the New Mexico state wetness index.
These results give important context to the issue of water scarcity in New Mexico. According to the Food and Water Watch, ”Two agricultural industries dominate water consumption. Alfalfa, the state’s dominant crop, guzzled 85 billion gallons of water in 2021, and pecan irrigation used another 93 billion gallons — sucking up 178 billion gallons between the two”(2023). Groundwater extraction has direct implications on the flow of the Rio Grande, the level of the Elephant Butte Reservoir, and, therefore, all of the cultural, economic, and recreational value New Mexicans receive from the Rio Grande. This analysis suggests that groundwater level will be a telling factor in predicting water levels in the Elephant Butte reservoir over the next several decades.
References
Albuquerque Journal. (2024). ”The Rio Grande: Arts and Lifestyle.” Available at: https://www.abqjournal.com/lifestyle/arts/article1c30c171 − 07be − 5b88 − 93ee − 36f ed38d351b.html[AccessedN ovember17, 2024].
Colorado State University. ”Climate Data Access.” Available at: https://climate.colostate.edu/dataaccessnew.html[AccessedNov.17, 2024].
National Integrated Drought Information System. ”Drought Historical Infor- mation - New Mexico.” Available at: https://www.drought.gov/historical- information?dataset=1selectedDateUSDM=20241119state=New-MexicoselectedDateSpi=20240901 [Accessed November 17, 2024].
Water Data for Texas. ”Elephant Butte Reservoir.” Available at: https://waterdatafortexas.org/reservoirs/individual/elephant-butte [Accessed November 17, 2024].
Food and Water Watch. (2023). ”New Mexico Water Crisis.” Available at: https://www.foodandwaterwatch.org/2023/07/06/new-mexico-water-crisis/: :text=Two[Accessed November 27, 2024].
Hlavac, Marek. (2022). stargazer: Well-Formatted Regression and Summary Statistics Tables. R package version 5.2.3. Available at: https://CRAN.R-project.org/package=stargazer.
National Centers for Environmental Information. ”Climate Data Online.” Available at: https://www.ncei.noaa.gov/cdo-web/datasets [Accessed November 17, 2024].
New Mexico Office of the State Engineer. (2015). ”Water Use Report for New Mexico, 2015.” Available at: https://www.ose.nm.gov/WUC/wucTechReports/2015/pdf/2015[Accessed November 27, 2024].
Rio Grande International Study Center. ”About the Rio Grande.” Available at: https://rgisc.org/about- the-rio-grande/ [Accessed November 17, 2024].
Blanco, D. (2024). ”Texas and New Mexico Water Dispute Reaches Supreme Court.” The Texas Tribune. Available at: https://www.texastribune.org/2024/11/04/texas-new-mexico-water-dispute-rio- grande-supreme-court/ [Accessed November 17, 2024].
U.S. Bureau of Reclamation. ”Elephant Butte Reservoir Data.” Archived at: https://web.archive.org/web/20060926130025/http://www.usbr.gov/ [Accessed November 15, 2024].
U.S. Geological Survey. ”How Wet is Your State? The Water Area of Each State.” Available at: https://www.usgs.gov/special-topics/water-science-school/science/how-wet-your-state-water-area- each-state [Accessed November 17, 2024].
U.S. Geological Survey. ”National Water Information System: Monthly Streamflow Data.” Available at: https://waterdata.usgs.gov/nwis/monthly?referredm odule = swsiten o = 321740106481004por321740106481004238876 = 1996815, 72019, 238876, 2002 − 09, 2023 − 08format = htmltabledatef ormat = Y Y Y Y − MM − DDrdbcompression = valuesubmittedf orm = parameterselectionlist[AccessedNovember15, 2024].
Phillips, F.M., et al. (2005). ”Reining in the Rio Grande: People, Land, and Water.” Water Resources Research, https://agupubs-onlinelibrary-wiley-com.sare.upf.edu/doi/full/10.1029/2005WR004427 [Accessed November 17, 2024].


