

The Strait of Hormuz Is Closed. Which U.S. State Grids Are Most Exposed?
Using historical price shocks and state-level electricity data, I estimate which power grids are most vulnerable to rising natural gas prices.
As Trump’s war with Iran enters its second month, the Strait of Hormuz remains closed. Energy markets have responded with higher oil and gas prices, which has translated into inflation across the board. Many economists and geopolitical analysts warn the worst may still lie ahead.
Nobody knows how long the Strait of Hormuz will stay closed, but each passing week increases pressure on the economy. We have never seen an energy crisis this bad before, but we can look to events like the start of the Ukraine war in 2022 to offer insights on how the economy could respond, and the effects aren’t spread evenly.
I used historical data on state electricity generation, prices, and demand, along with fossil fuel price volatility during the Ukraine war, to estimate how reliance on natural gas exposes states to geopolitical risk. While the US is more insulated from the Iran oil price shocks than countries like Japan, India, and much of Asia, the variation between states reveals how energy policy can either protect or expose consumers.
Today’s post will put this unprecedented energy crisis in context. I’ll explain how LNG prices affect electricity prices in certain states more, and how the situation is likely to get worse before it gets better.
The Strait of Hormuz Shock
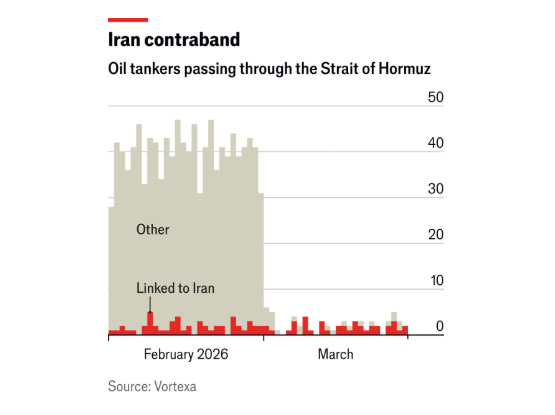
Energy markets reacted when the Strait of Hormuz closed two weeks ago due to the attack on Iran from the US and Israel. As shown in the graph above, non-Iranian shipping traffic was cut off in the Strait that carries one fifth of global oil and gas supply. Despite Trump’s pleading for help from allies, the narrow passageway has remained closed except to ships carrying oil bound for China, and it’s still unclear how long shipping will be restricted.
As with many modern conflicts, early expectations of a short war have proven overly optimistic. We learned from the Iraq war and the invasion of Ukraine that there is no telling how long the Iranian conflict will squeeze oil markets. And each week that passes with the Strait still closed, the negative economic effects are exacerbated into the future.
In fact, much of the world hasn’t felt the worst part of the Strait’s closing. Oil tankers move extremely slow - about the speed of a bicycle. The last US-bound shipments that exited the Strait of Hormuz are scheduled to reach Louisiana in mid-April. This is when the real supply constraints will likely be felt.
Consequently, even if the war were to end today, it could be months until shipping resumes, and then months after that until oil and gas are delivered to end users.
But it doesn’t look like the conflict is ending anytime soon. In his primetime address on the night of April fools day, Trump vowed to “hit” Iran “extremely hard over the next two to three weeks,” suggesting we’re still at least weeks away from peace talks, or any type of “deal” to come to fruition. Trump’s word is all we have to go off of, but I’m wary to believe any signal Trump sends given his record of using a press release to influence financial markets.
And worried about the markets he is.
The fact that the US has un-sanctioned both Iranian and Russian fossil fuels, the primary war-financing mechanisms of two of America’s greatest enemies, is telling enough that Trump knows he doesn’t have the political backing to withstand higher energy prices. It also suggests he didn’t fully think this through since Russia, China, and Iran are all making more in oil and gas revenue than they were before the war started.
Trump’s contradicting energy and geopolitical policies don’t end there - domestic renewable energy production has slowed due to Republican policies. But before we get to the state of America’s grid, let’s see what we can learn from historical energy crises as this historic one unfolds.
Lessons from past energy crises
The shock that everyone is calling back to right now is the 1970’s oil price shocks that spiraled from the conflict between Israel, Syria, and Egypt. Egypt and Syria launched an attack on Israel on Yom Kippur, a major religious holiday, in 1973. OPEC producers coordinated production cuts, effectively raising prices to specifically target Western allies of Israel, who were oil dependent and net importers to varying degrees.
Famously, the US imposed gasoline price controls and nationwide speed limits in an attempt to ease the shortage, which only caused further economic issues. Despite the conflict only lasting a few months to a year, the 1973 price shock is largely blamed for the 10-15 years of economic turmoil and inflation to follow. The duality of stagnant growth and inflation led to the coining of the term stagflation (a term that has circled Trump since his infamous and illegal “Liberation Day” tariffs).
A recession hit the US, Europe, and Japan, and they couldn’t quickly turn away from fossil fuels, and so higher prices and lower output persisted into the 1980s.
The Ukraine shock
When we analyze the heterogeneous effects of the Ukraine war, we see some similarities, though the geographical energy mixes and aggressors changed. And, notably, we see that some smart European countries had insulated themselves from oil and gas volatility by investing in renewables.
A recent paper from my friend Lucien Vargas at BBVA, a bank, reports that “Spain’s renewable-based power model has increased resilience to external energy shocks, especially at the wholesale level…”
LNG prices affect electricity prices for at least two reasons: the competitive merit order of electricity dispatching, and import reliance. The merit order of electricity dispatch results in the most expensive generation input setting the price of electricity, which is often natural gas or coal. And the degree to which a country is reliant on another nation’s natural gas helps set the price they’re willing to pay for it. The US, today, is the world’s largest producer of oil and gas - meaning the US, as a whole, is less affected than Asia or Europe. But electric grids within the US aren’t totally immune to price swings, and they’re affected unevenly.
Natural gas in America
Since 2017, the US has been a net exporter of oil and gas, so the closing of the Strait of Hormuz is, so far, less economically damaging than the 1970s crisis. Technological advancements in fracking opened up fossil fuel assets in the Permian Basin, giving the US a boost of energy. This domestic strength could have given Trump the impression that the Strait of Hormuz closing wouldn’t be that big of deal for the US, but the negative effects are still there.
US gasoline prices are now around $4, and we should expect higher prices in everything from groceries to electronics to travel, and more. Forecasts for the Henry Hub, which serves as the benchmark LNG price coming out of North America, are fairly steady over the short term with expectations for slightly higher prices over the long term. But global market dynamics could play out to hurt America as demand for natural gas increases globally.
Volatility can happen at any moment. The Ukraine war led to a natural gas price spike in the US, and an unexpected cold snap in the northeast led to another spike in early 2026, weeks before the Iran war started.

If demand elsewhere exceeds the US’s ability to resupply itself, Europe, and Asia, prices could surely rise. Even the most insulated natural-gas-producing country in the world isn’t fully removed from global markets.
Estimating LNG’s effect on US electricity prices
Like we see on the international level, LNG prices affect US states unevenly. Spain’s investment in renewables insulates them from geopolitical conflicts, and US states that are un-allergic to clean energy are also insulated. I built a regression model to illustrate these effects.
I estimated how electricity prices reacted to the Ukraine invasion by regressing monthly state-level prices on the interaction between the state’s pre-war LNG generation share and an indicator for the period after Russia invaded Ukraine. I control for electricity demand, include state-level fixed effects to account for differences between states, and added year-month fixed effects to account for nationwide trends.
Here’s the math for the nerds:
Where:
The key coefficient, β, measures how much more electricity prices rise based on each state’s reliance on natural gas to power their electric grid. I then used this coefficient to predict how future price increases will affect the grid in each state using the following equation, which assumes gas prices rise $1.50 (Henry Iran).
I also assumed grid mixes haven’t changed too much since 2021, meaning the effects could be slightly overstated, but a price shock of just $1.50 is smaller than historical price shocks, and many state’s grid mixes haven’t changed too much.
All in all, it’s a back-of-the-envelope model that proves an important point: states with less reliance on LNG will be less affected by the Iran war and other future conflicts.
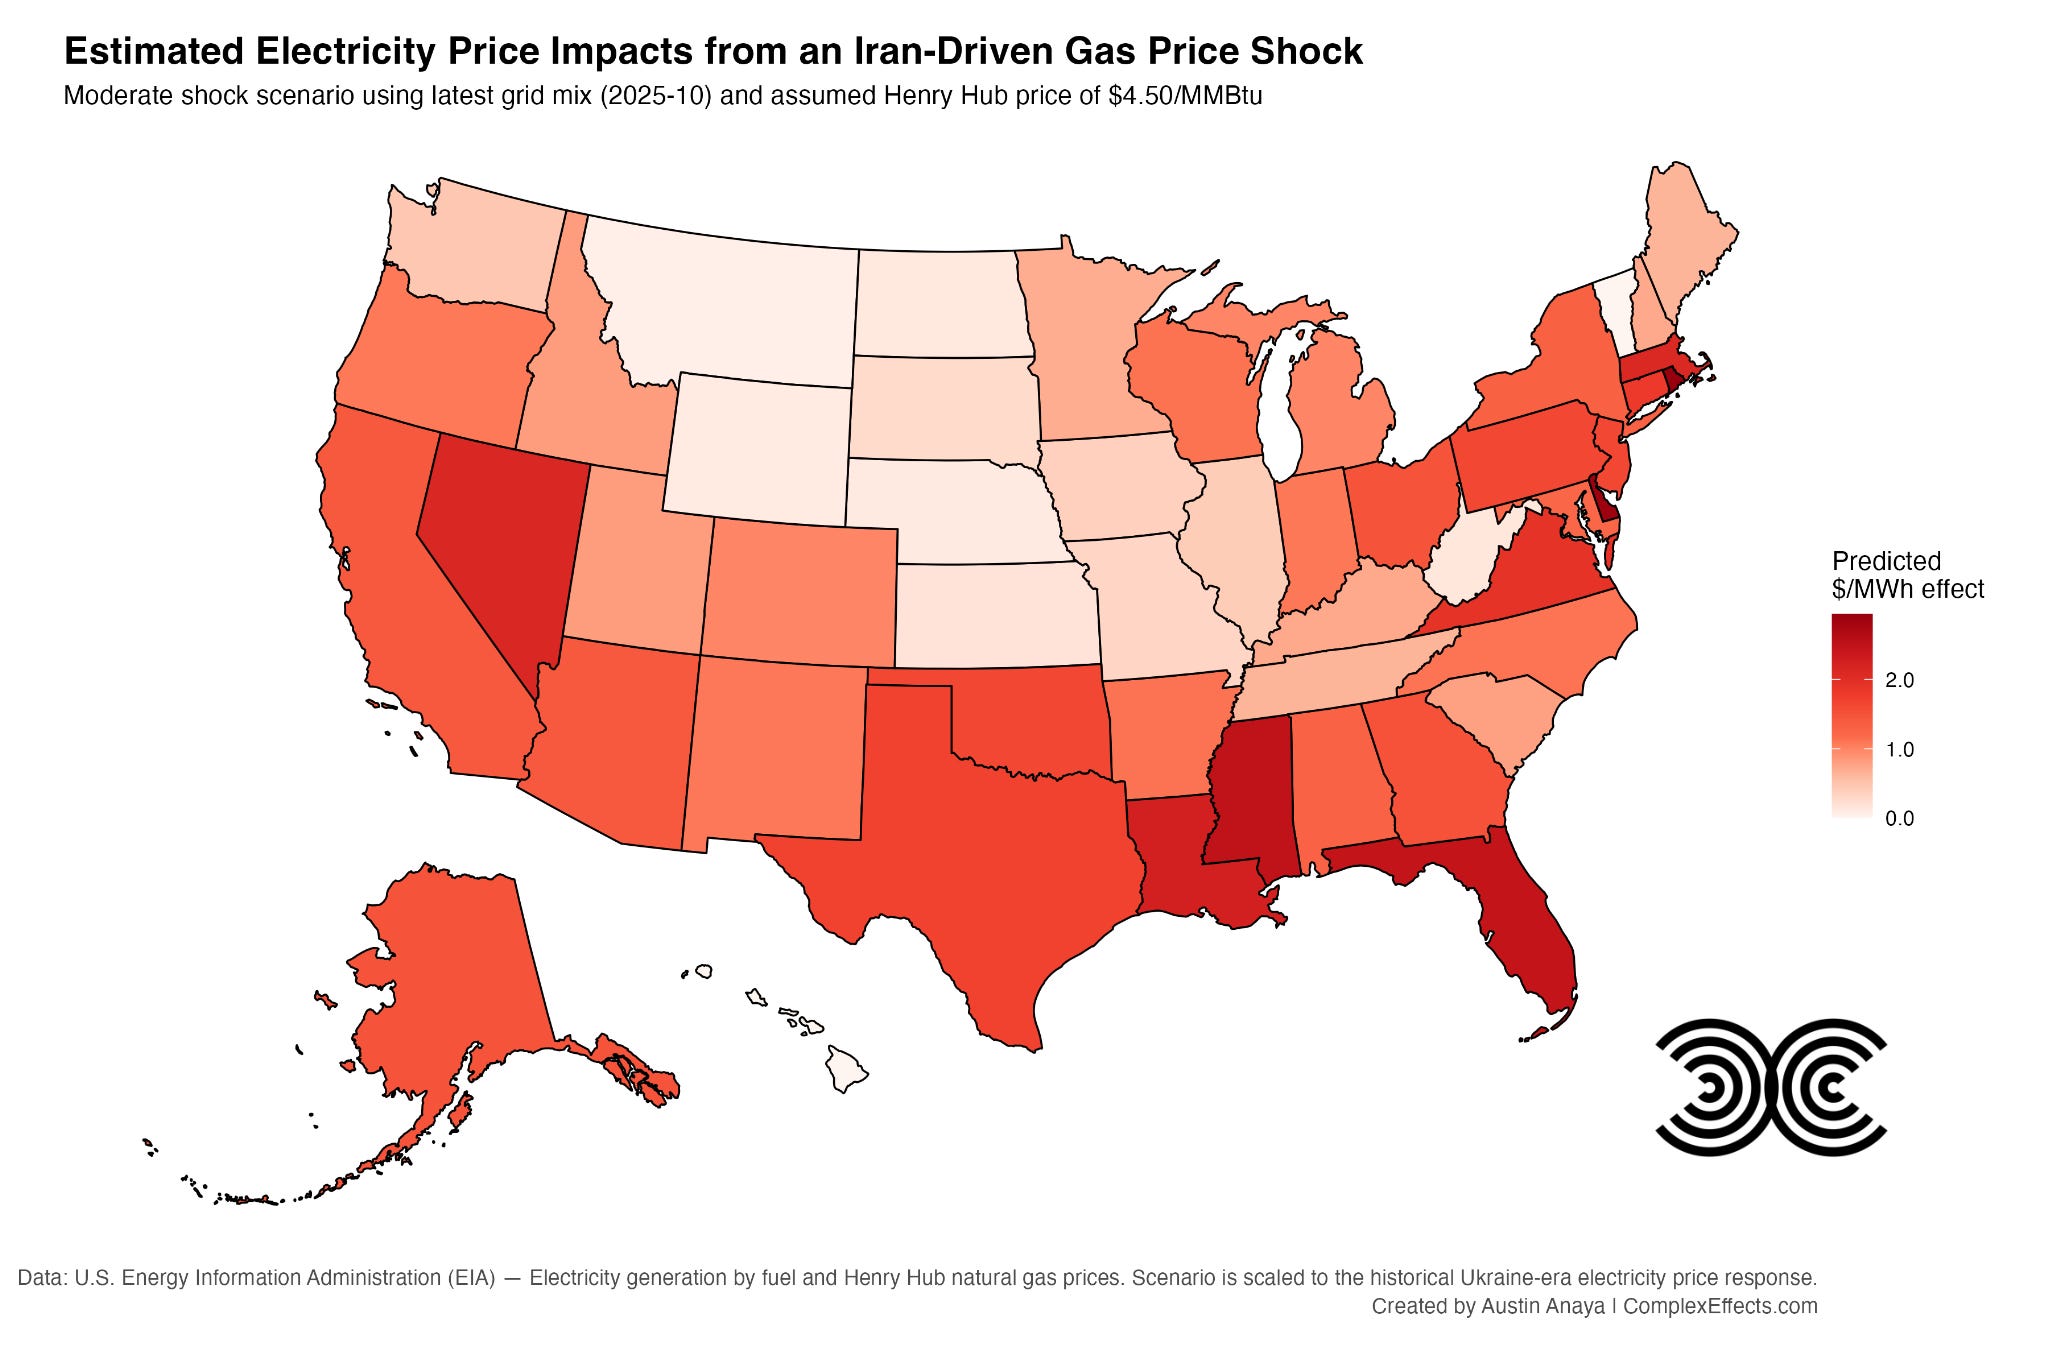
The map below illustrates my findings. The darker the red, the more electricity prices will increase in response to a $1.50 LNG price increase.

And here are the predicted percentage price increases shown as a comparative bar chart.
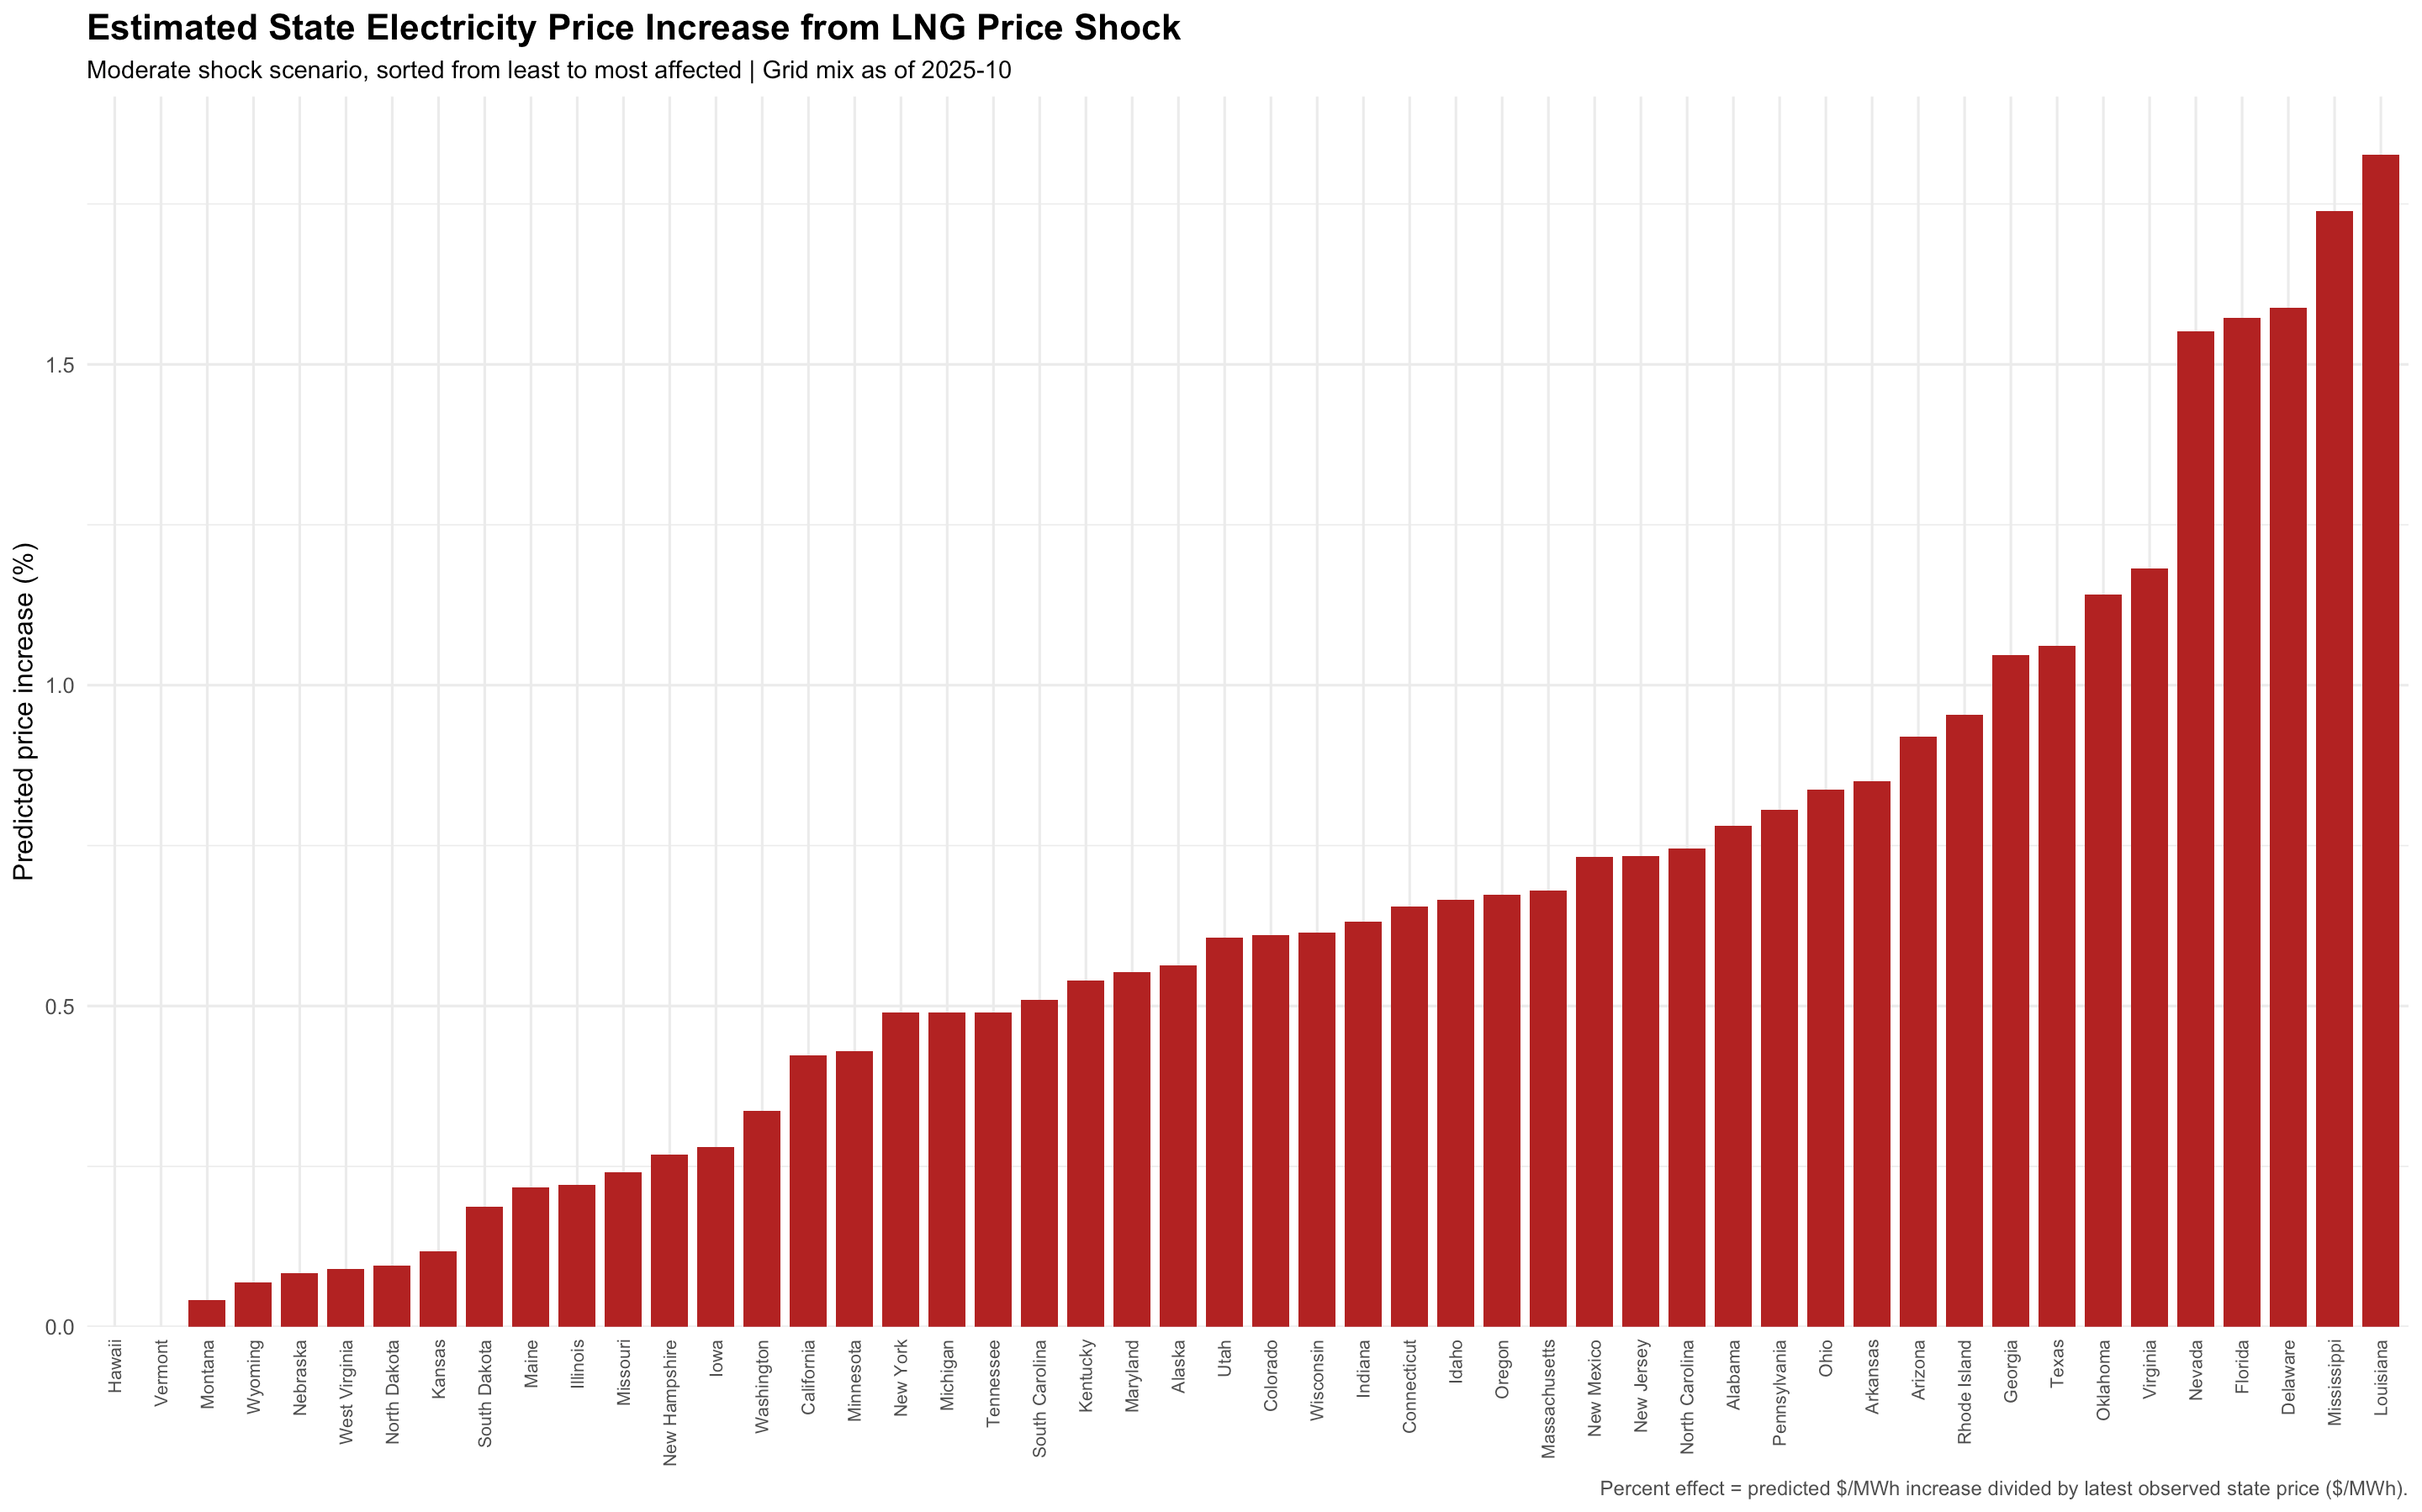
These aren’t necessarily graphs showing the dirty grids and the clean grids - just the gas-heavy grids exposed to LNG price shocks. Coal-heavy Wyoming is less affected by LNG prices than wind-heavy New Mexico because Wyoming simply uses less gas, relatively. And Hawaii is likely even more affected by the closing of the Strait of Hormuz because they rely heavily on oil to power their grid, though they’re expected to decarbonize moving forward.
Many countries are now considering extending the life of their coal-powered plants in response to recent geopolitical shocks - a bad thing for the climate, but more of a band-aid than a real solution. While coal-heavy states can be less exposed to LNG price swings, the levelized cost of coal is still much higher than most renewables.
There is a lot of nuance to consider when comparing the results of my model, but here are a few underlying facts to consider:
Oil and gas generation exposes you to more geopolitical risks.
Southern, Republican states are among those most exposed.
Coal plants may help with short-term price stability, but only if you have existing plants. It’s still one of the most expensive inputs for electricity, even without considering the social cost of carbon.
Wind gusts and solar rays don’t have to traverse the Strait of Hormuz.
Between Trump’s decision to back Israel’s attack on Iran, and his anti-renewable, climate-change-denying domestic policy, smart energy policy has really been left to the states. For the past 10-20 years, we’ve been witnessing a separation between the states that do, and the states that don’t, have a plan for the future of energy. Tomorrow’s economy will be built on data centers; electrified manufacturing, transportation, and homes; and a resilience to geopolitical pressure. Some states will win in that economy, and others won’t.
China continues to outbuild the US in terms of renewable energy, batteries, bullet trains, and electric vehicles. US allies are realigning their own political posture considering the shifting power paradigm. The US has a lot to ponder as the 2026 midterm elections approach in November. Trump is undoubtedly worried about rising prices. If LNG prices spike, red and purple states will be hurt the most.
Very cool article
I have a blog wherein I get people accustomed to climate and sustainability in 3 min reads twice a week
Wrote about the big bad methane and what is it that makes it worse - with some cool facts! Hope it’s interesting
https://substack.com/@susitout/note/p-193457928?r=3pcwen&utm_medium=ios&utm_source=notes-share-action