

Comparing British Interconnectors and Battery Alternatives
Our Master's thesis shows how each of Britain's interconnectors affects prices and emissions — and how batteries can either substitute for or complement them.


Over the past few weeks I’ve been setting the foundation for my recently finished master’s thesis. First, I explained how the economics of electricity markets work, and why renewables will eventually win. Then, I explained a model we built showing how the UK is overcoming renewable intermittency using transmission lines to regions with different renewable energy capabilities. Today, I’m going to share some of the main results from my group’s thesis project, which builds upon my last two posts, though reading the previous two posts is not entirely necessary.
Our thesis evaluates the role of cross-border interconnection in Great Britain’s electricity market. Using both reduced-form regressions and a detailed structural model of the British electricity grid, we quantify the impact of interconnector capacity on wholesale electricity prices, consumer surplus, and domestic and imported emissions.
I’m proud to share that our thesis group, consisting of myself, Euan Gilchrist, Charles Nicholson, and Andrew Wells, received a top-of-class grade with a 10/10. To see all of our results, feel free to read the entire paper, which is attached at the bottom of this post.
Motivation and research question
First of all, why did we focus on Great Britain?
Euan and Charlie are both from Britain, and Andrew worked in the British energy market before - but that’s not entirely why we’re interested in British energy. We decided to focus our thesis on GB because it offers a terrific setting to study interconnectors, batteries, and grid decarbonization. Britain’s liberalized electricity grid is compelling because it’s physically isolated from continental Europe - highlighting the importance of interconnectors and batteries for balancing supply and demand.
Also, Britain has steep climate goals. The UK aims to be net zero by 2050, following the Paris Agreement, and their electricity grid is set to reach net zero far before that. They’ve made great strides in grid decarbonization in recent decades thanks to their aggressive investment in domestic renewables, interconnectors, and battery storage. Their rapid deployment of these technologies helped them completely remove coal from their domestic electricity generation, a feat few countries have achieved.
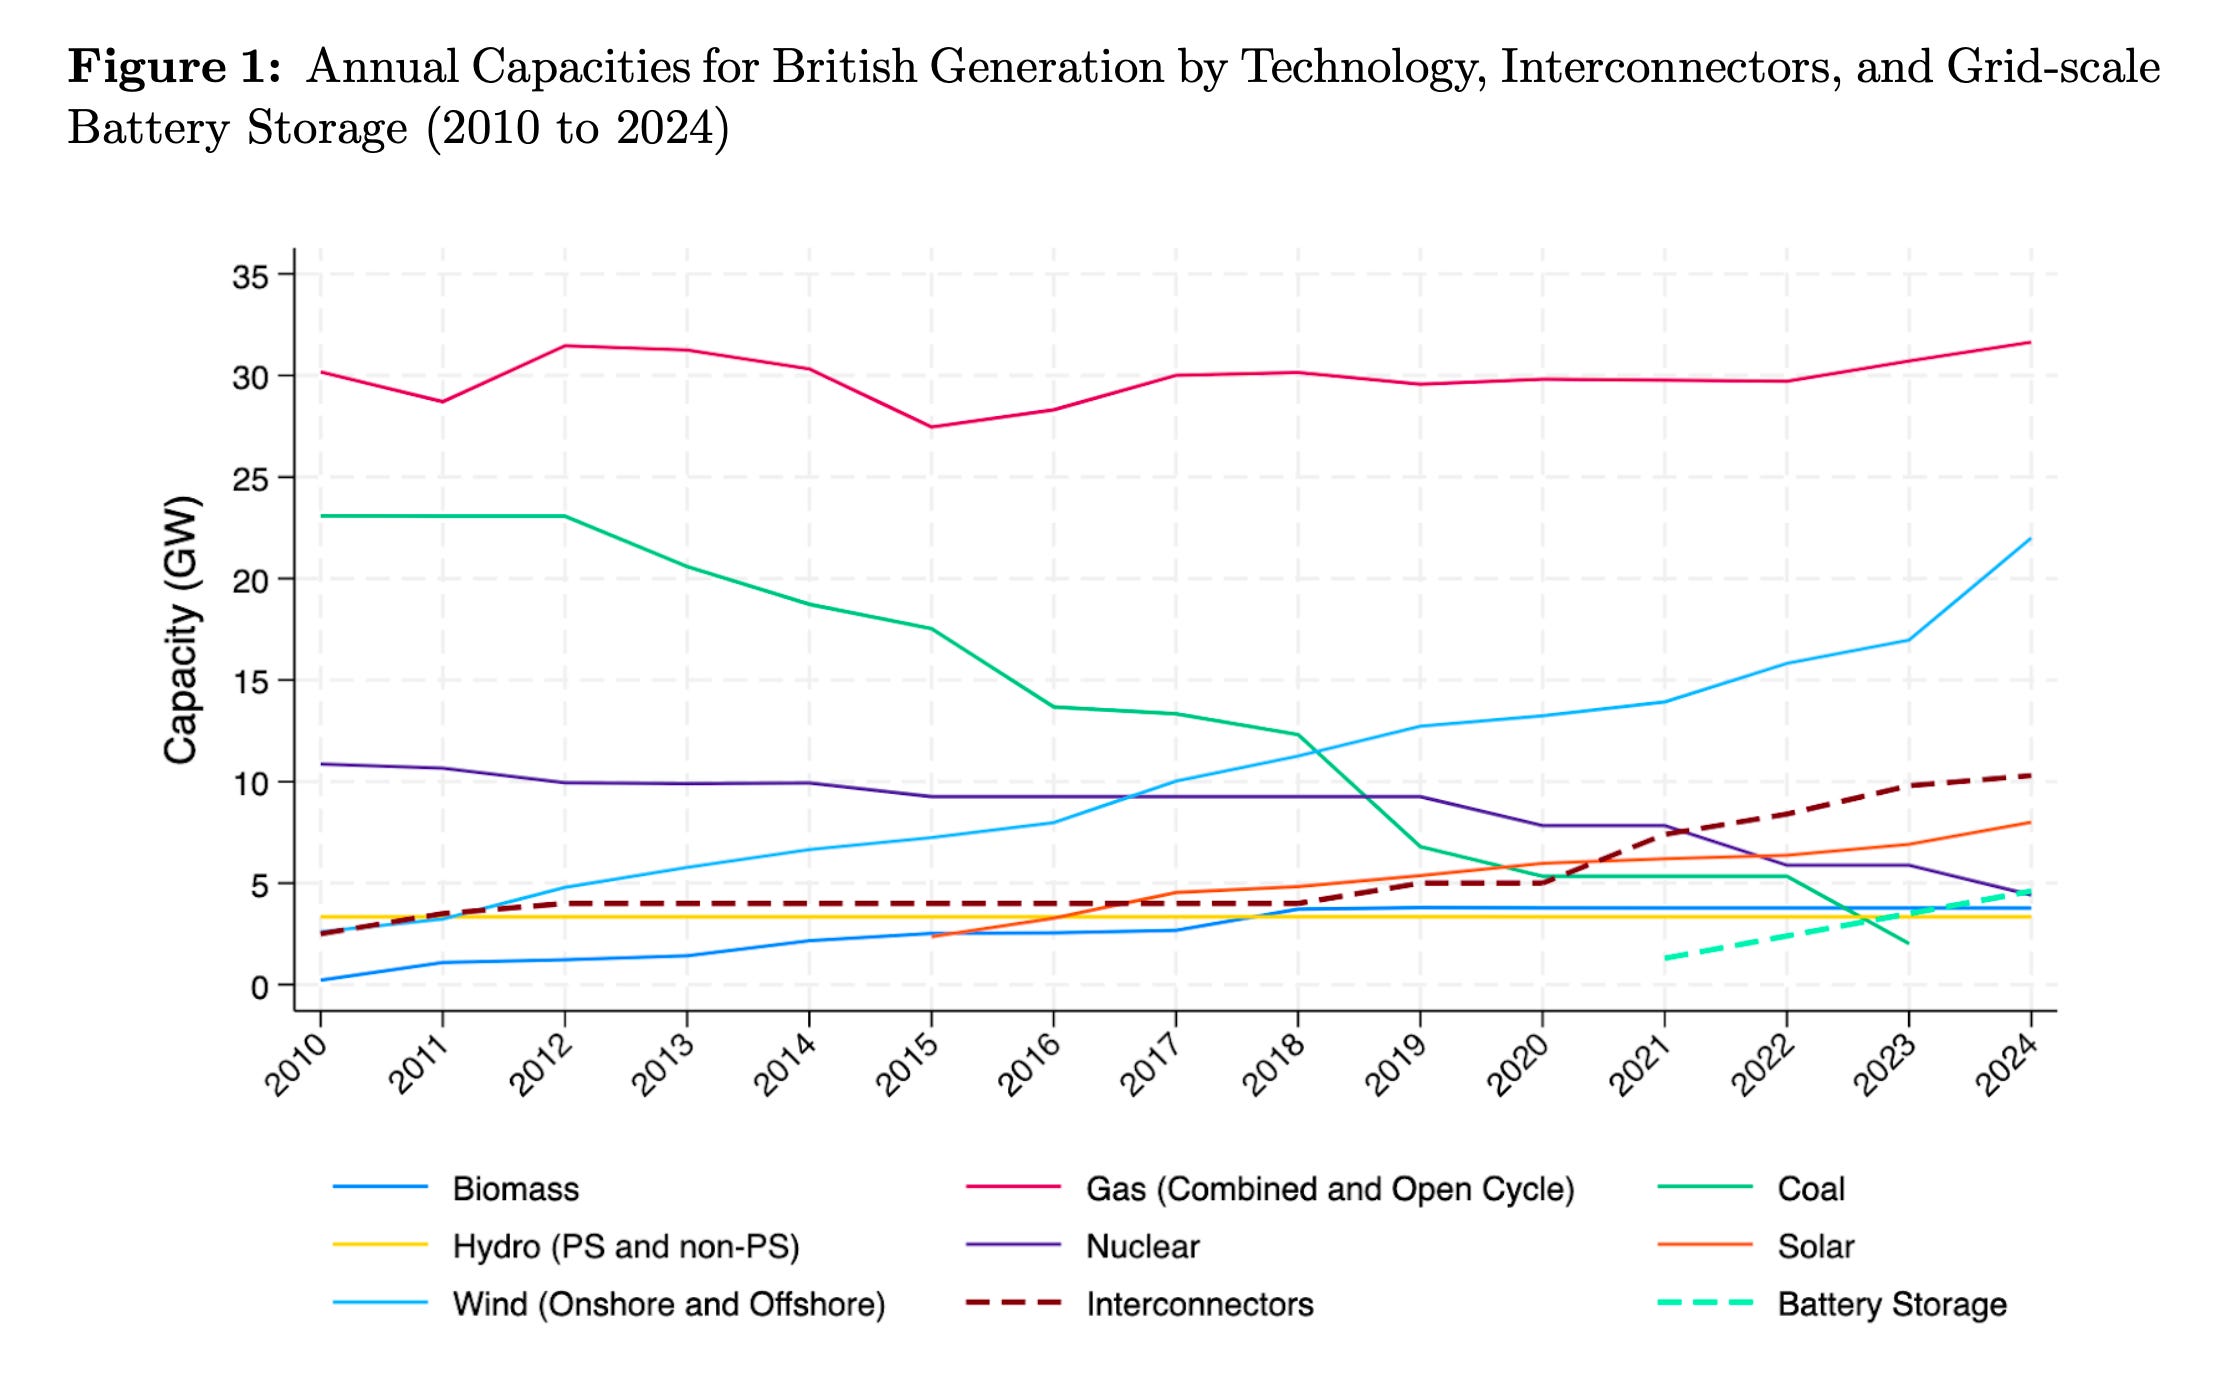
Much of this achievement is due to their increasing investment in renewable energy, such as on- and off-shore wind, and their leading deployment of grid-scale battery storage.
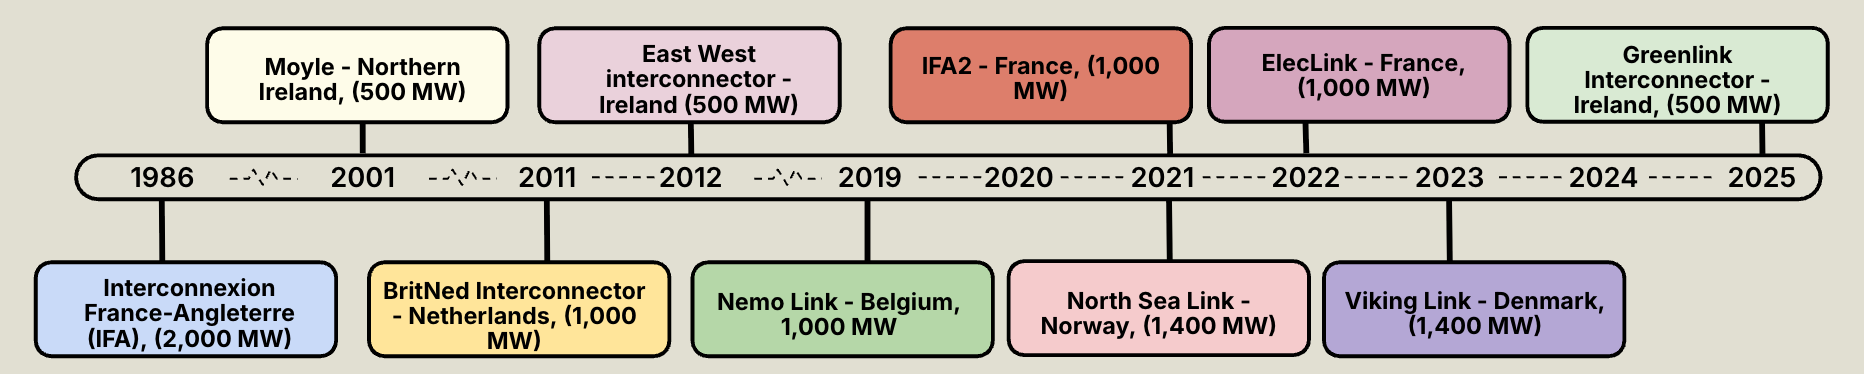
And Great Britain has been building more and more interconnectors with European countries. They’ve nearly quadrupled their interconnector capacity since 2010, giving them a total of 10.3 GW of import/export capacity:
While interconnecting grids is great, we realize that who you connect with is equally or more important. Each of Britain’s connected countries has a different grid-mix, and therefore send Britain electricity with differing prices and emission levels. France is very nuclear-heavy; Denmark sends a lot of wind-generated power; and Norway sends mostly hydro:
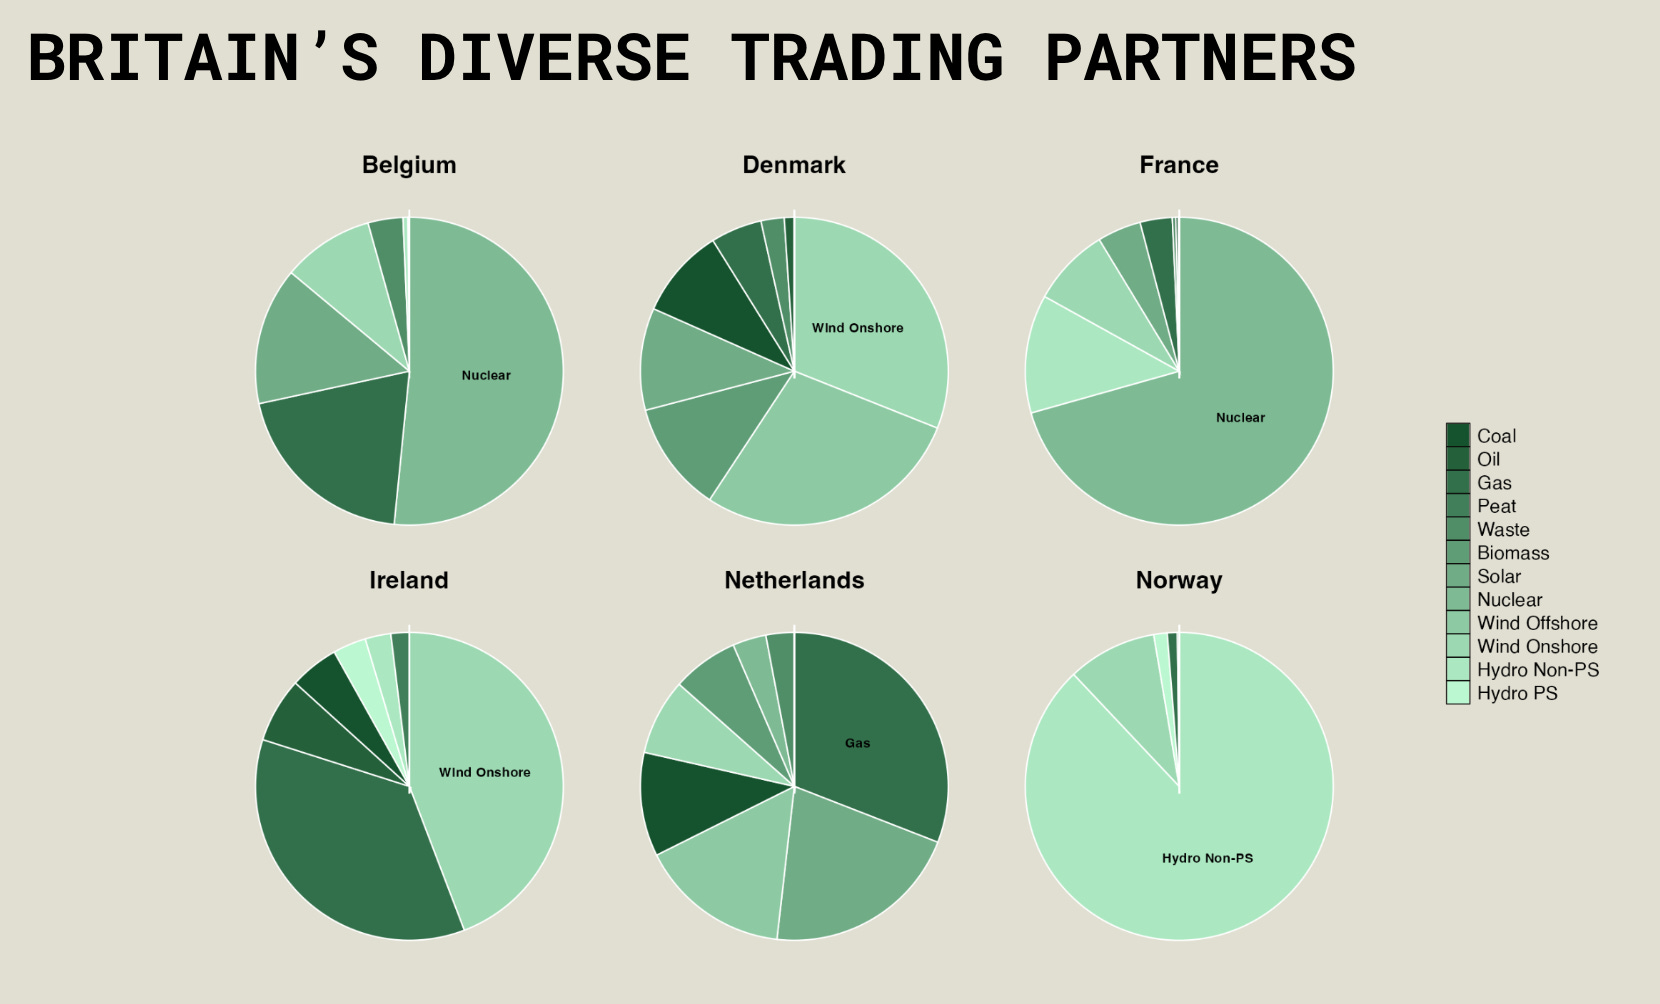
Each of these country’s grid-mixes reflects their geographic niches and political acceptance of varying technologies. And each of these technologies comes with varying degrees of intermittency - Denmark’s wind is cheap but isn’t always available; France’s nuclear isn’t as cheap as wind, but serves as an always-on baseload; Norway’s hydro is cheap and the non-pumped-storage hydro is always on; and so on... This diversified group of trading partners gives Britain access to cheap electricity that complements their own grid.
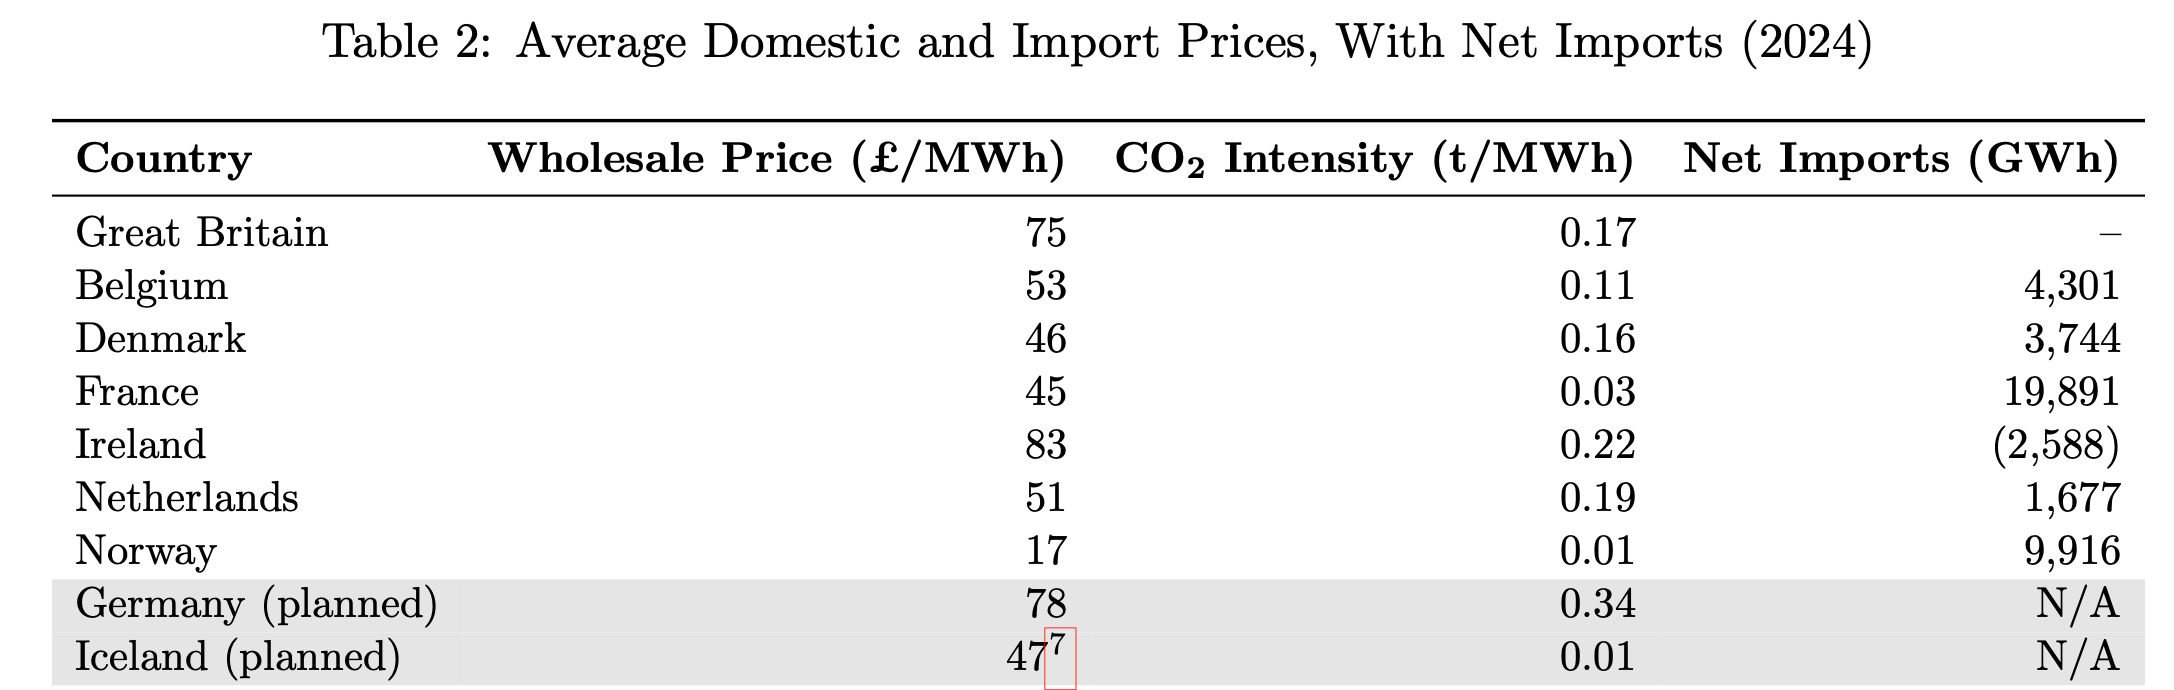
Britain has historically had higher wholesale electricity prices than each of the countries it is interconnected with besides Ireland. As a result, Britain is generally a net importer from mainland Europe and a net exporter to Ireland. These trends are summarized in Table 2:
We wanted to test the effect of each of these interconnections on the UK grid, and see if other investments, like batteries, would have been better for prices. More specifically, our research question is:
What is the impact of Great Britain's interconnector investment, and would alternative investments offer greater returns to society?
To answer this question, we took methodological inspiration from a paper our professor, Dr. Mar Reguant, co-authored: The Dynamic Impact of Market Integration: Evidence from Renewable Energy Expansion in Chile (Gonzales et al., 2022). Gonzales et al. analyze the addition of a transmission line connecting renewable assets in the Chilean Atacama Desert to the demand centers such as Santiago further south. They use a combination of reduced-form and structural models to measure the effects, basically because the two approaches complement each other - making up for each others limitations.
We apply Gonzales et al.’s regression approach to Britain’s six interconnected partners, and expand on it by using interconnector outages to add variation to our independent variables of interest. Given some of the limitations of this regression approach, the second part of our paper takes a structural approach (a sort of toy version of the UK grid and its interconnectors built using the coding language Python). Counterfactual analysis of a structural model allows us to validate results from our reduced-form model, as well as explore impacts on consumer welfare and emissions.
Finally, we extend our structural model to include investment, closely following Reguant’s approach used to model the Californian grid (2019). In addition to the investment mix considered by Reguant, we also consider the potential for additional investment in batteries. This allows us to assess the findings of Biancardi et al. (2024) in a British context; that is, whether batteries can be an effective alternative to interconnectors in alleviating renewable intermittency.
Reduced form methodology and results
Our reduced-form models regress British wholesale electricity prices on a range of controls and, our variables of interest, British interconnector capacity with each country. (Gonzales et al., 2022) adopt an event-study approach; prices are regressed on a dummy variable that identifies the date of connection. We advance this approach by replacing this dummy variable with a variable that captures hourly variation in interconnector capacity (accounting for, for example, outages).
As shown in Figure 2 below, the outputs from the reduced-form model suggest that Britain’s interconnectors tend to have had a statistically significant negative impact on British prices. The direction and magnitude of these effects align with previous estimates on the price impact of British interconnection by MacIver et al. (2021) and Zakeri et al., (2018).
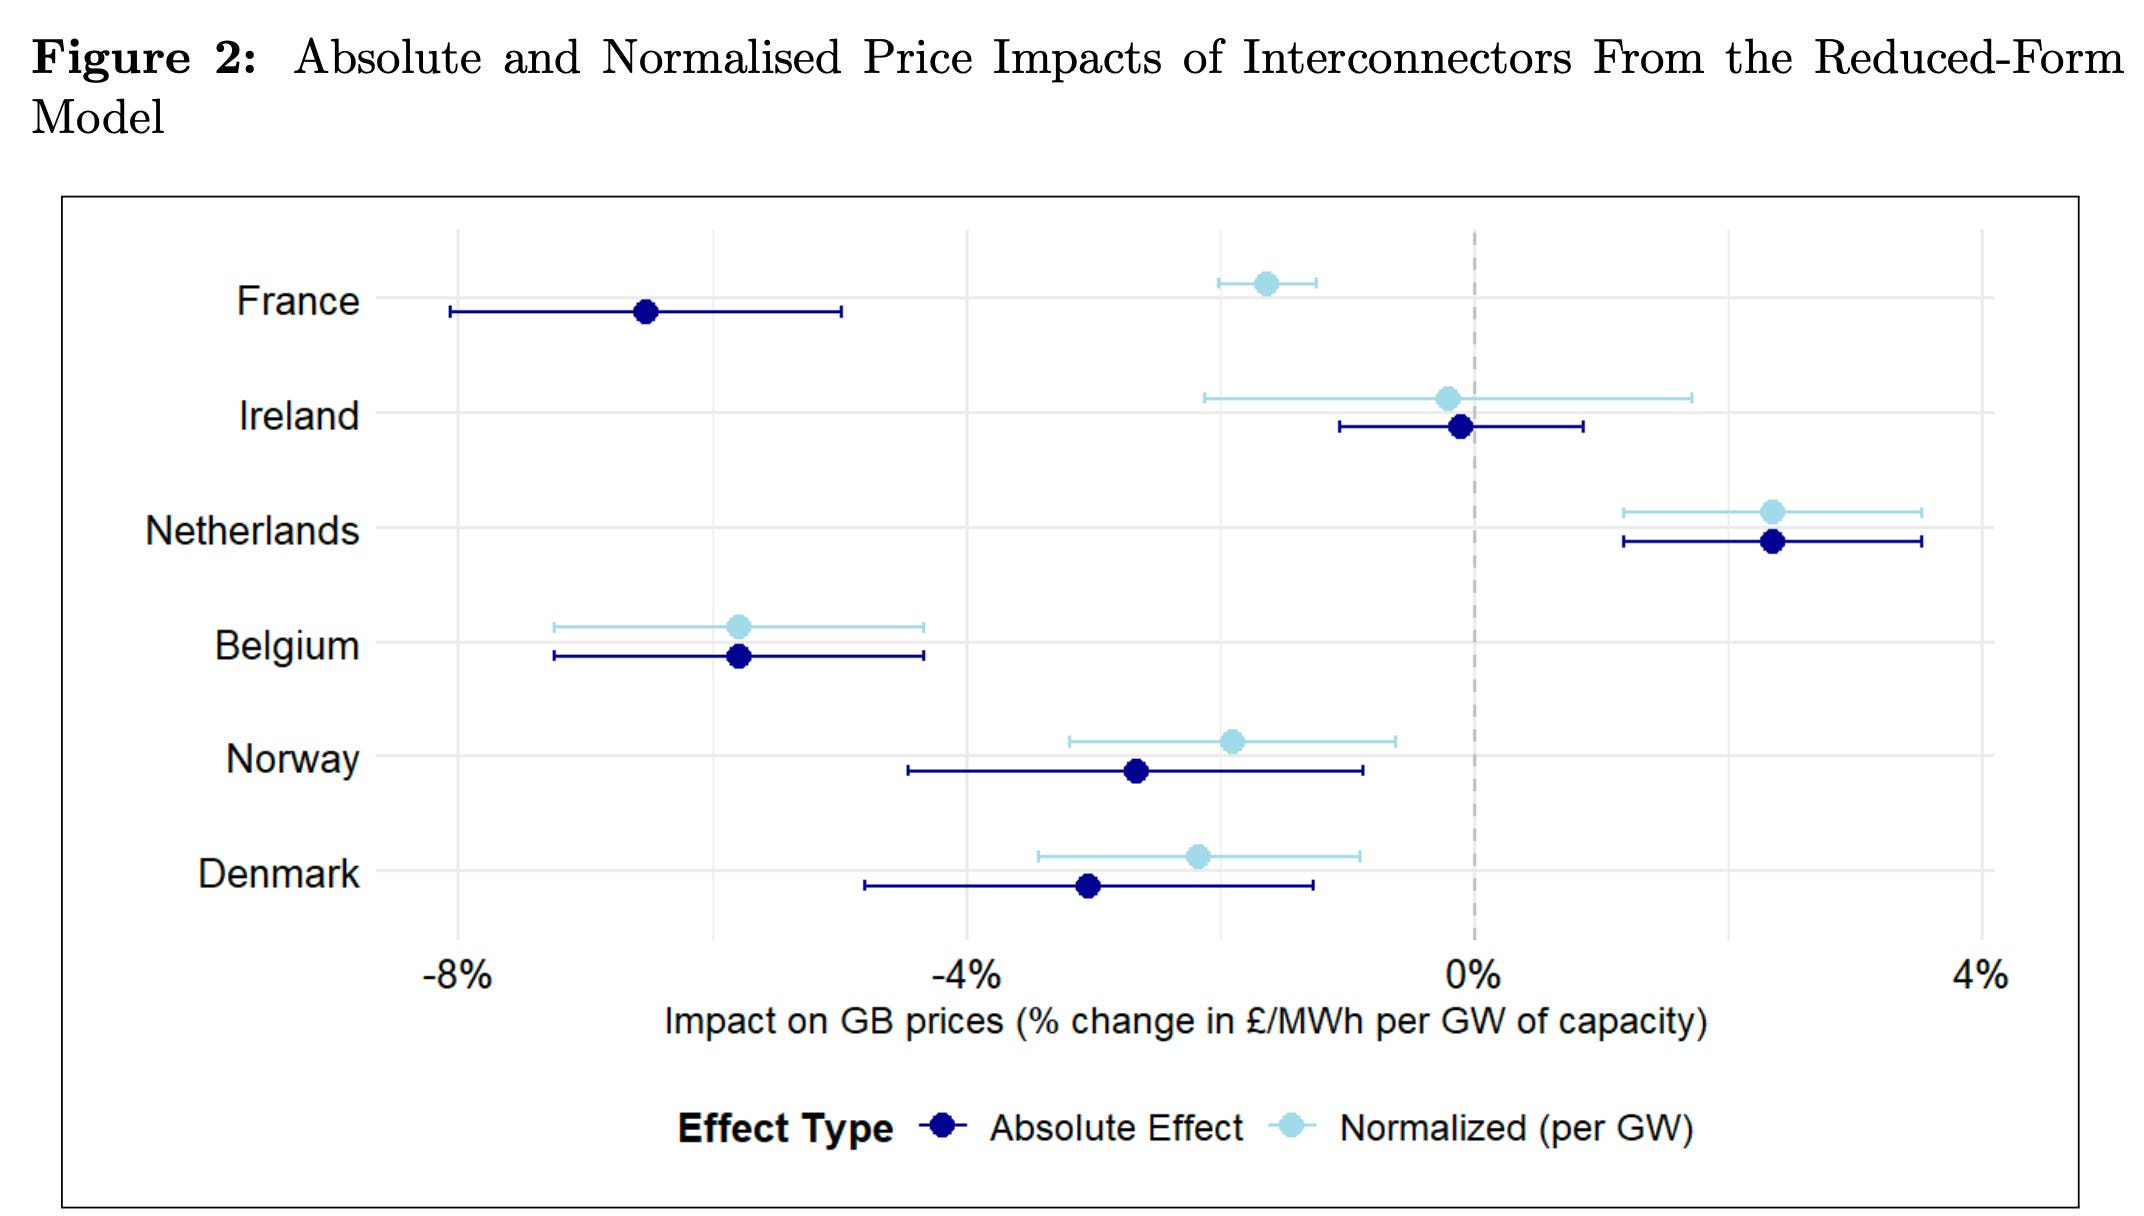
On a country-by-country basis, our reduced-form findings are as follows:
Interconnectors with France are found to have the largest effect on average prices, decreasing prices by between 5% – 8.1%. This is unsurprising given the relative size of the French interconnectors, and it being a net importer. This effect is somewhat smaller when normalized to a per-GW effect; prices decrease by between 1.2% – 2%.
The Belgium interconnector is found to have the largest normalized per-GW impact, decreasing average prices by between 4.3% – 7.2%. As this is a 1 GW interconnector, the total and normalized effects are equivalent. The relatively large normalized effect relative to France is somewhat surprising given these two countries’ grids are highly integrated.
The interconnectors with Norway (0.9% – 4.5%) and Denmark (1.3% – 4.8%) are found to have similar, negative, effects on average prices. The direction of these effects aligns with Britain being a net importer from these countries. However, given the larger price difference and higher imports from Norway, the similar scale of effect is surprising. Normalized price effects imply a 0.9% – 4.5% and 0.6% – 3.2% decrease in average prices for Denmark and Norway, respectively.
The only interconnector found to increase average prices is the Netherlands (1.2% – 3.5%). This result appears inconsistent with Britain’s position as a net importer from the Netherlands. As this is a 1 GW interconnector, the total and normalized effects are equivalent.
The Ireland interconnectors have no statistically significant impact on British prices (-1.1% –0.9%). The upper end of this estimate appears consistent with the small level of net exports, the typically small difference in prices and the relatively small size of these interconnectors.
We also ran an alternative regression which allows us to understand how the impact of capacity on prices evolves at different hours of the day. This model is equivalent to the previous model, aside from the introduction of an interaction term which captures interactions between each interconnector and the hours of the day. This allows us to understand whether the average effects in the baseline model hide any variation across the day.
This alternative version of the reduced-form model shows that interconnector price impacts are heterogeneous across the day. Figure 3 presents these effects by hour, illustrating that different interconnections are somewhat specialized to serve different groupings of demand.
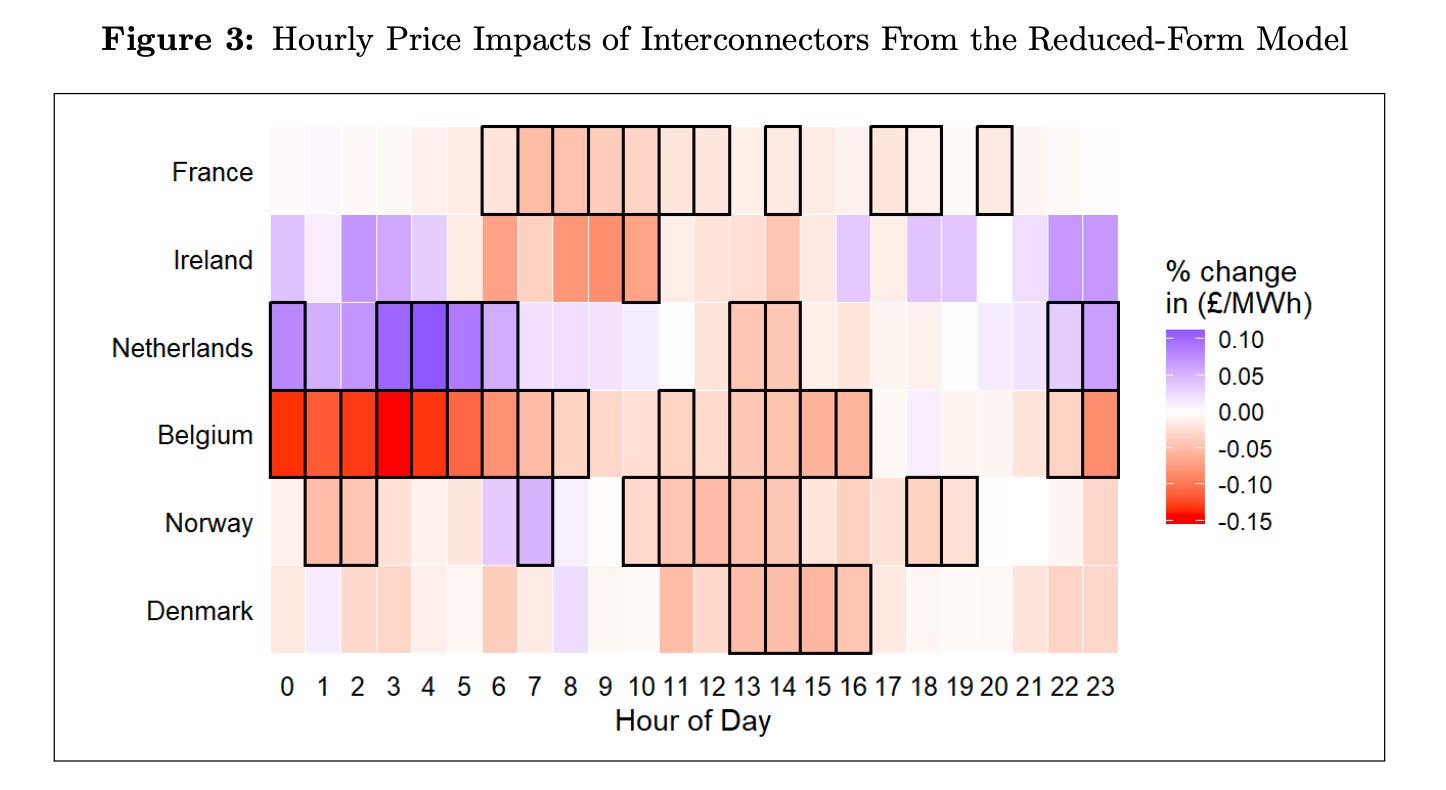
On a country-by-country basis, our alternative reduced-form findings are as follows:
The French interconnectors generate negative price effects across most hours of the day, these effects are strongest in the morning peak where average prices are decreased by up to 4.8%.
The Netherlands interconnector generates large positive price effects during the night and some smaller positive price effects during the day.
The Belgium interconnector shows strong negative effects during all periods except peak hours. Effects are strongest during the night where average prices are consistently reduced by over 10%.
Both the Norway and Denmark interconnectors are associated with consistent negative price effects during daytime hours. The Norway interconnector also shows some smaller negative effects of up to 3.5% during the evening peak.
For the Irish interconnections, only a single hour shows a statistically significant price effect (10am).
There are several limitations of the reduced-form approach that we address with the structural model, including how the regression approach only assesses the impact of new interconnections against the prevailing energy market conditions. This is problematic because we are comparing across several interconnections introduced across a time-period that encompasses the energy market crisis of 2022-23 caused by Russia’s invasion of Ukraine. Also, this approach ignores how interconnection dynamically impacts incentives to investment in different technologies.
Despite these limitations, we find our reduced-form results to complement our structural model, and the two models give similar results. As mentioned before, we took note of the approach used by Gonzales et al. to address the limitations of a regression based analysis by building a structural model.
Structural model method and results
The beauty of the structural model is it allows us to test counterfactuals in a way not possible with a regression. This model allows us to run a series of counterfactual simulations in which interconnections with each country are disabled one at a time. We then compare electricity prices, consumer welfare, and domestic and imported CO2 emissions in each counterfactual scenario. In other words, we are able to “turn off” each of the interconnectors, one at a time, and measure the effect of its absence on the British grid.
We adopt a social planner framework to simulate the British wholesale electricity market under these varying interconnection counterfactuals. We instruct the social planner in our model to maximize aggregate net surplus, defined as gross consumer surplus minus generation costs, battery degradation costs, and the cost of net imports. This approach abstracts from market power or strategic bidding behavior and instead focuses on what a welfare-maximizing central planner would choose under perfect foresight and zero market frictions.
For you nerds out there, this model is implemented in Pyomo using the mixed-integer programming (MIP) solver Gurobi. Translation for everyone else: we used a computer tool that finds the best solution in a very complex problem. Our model thus represents the British electricity grid at an hourly resolution for 2024, capturing dynamics across different points in time.
We fed our model the following information:
hourly demand for all of 2024 in Britain;
hourly electricity prices for all of 2024 for Britain and each of the interconnected countries;
the types and amounts of energy generation present in Britain in 2024 constrained by installed capacity and capacity factors;
the average UK carbon price for 2024 (UK ETS);
import elasticities for each interconnected country (estimated using the same technique used by Reguant (2019));
constraints on battery charge/discharge and degradation; and
the import/export capacity of each of the interconnected countries
We then let Gurobi take the wheel and utilize existing generation types, charge and discharge batteries, and trade with interconnected countries - all with the goal of reducing prices in Britain for each hour of the year. We then compare electricity prices, consumer welfare, and domestic and imported CO2 emissions in each counterfactual scenario to those in the baseline model, where all interconnectors are fully operating.
Figure 4 below presents absolute and normalized changes in British wholesale prices and consumer surplus when each interconnector is disabled, relative to our baseline model.
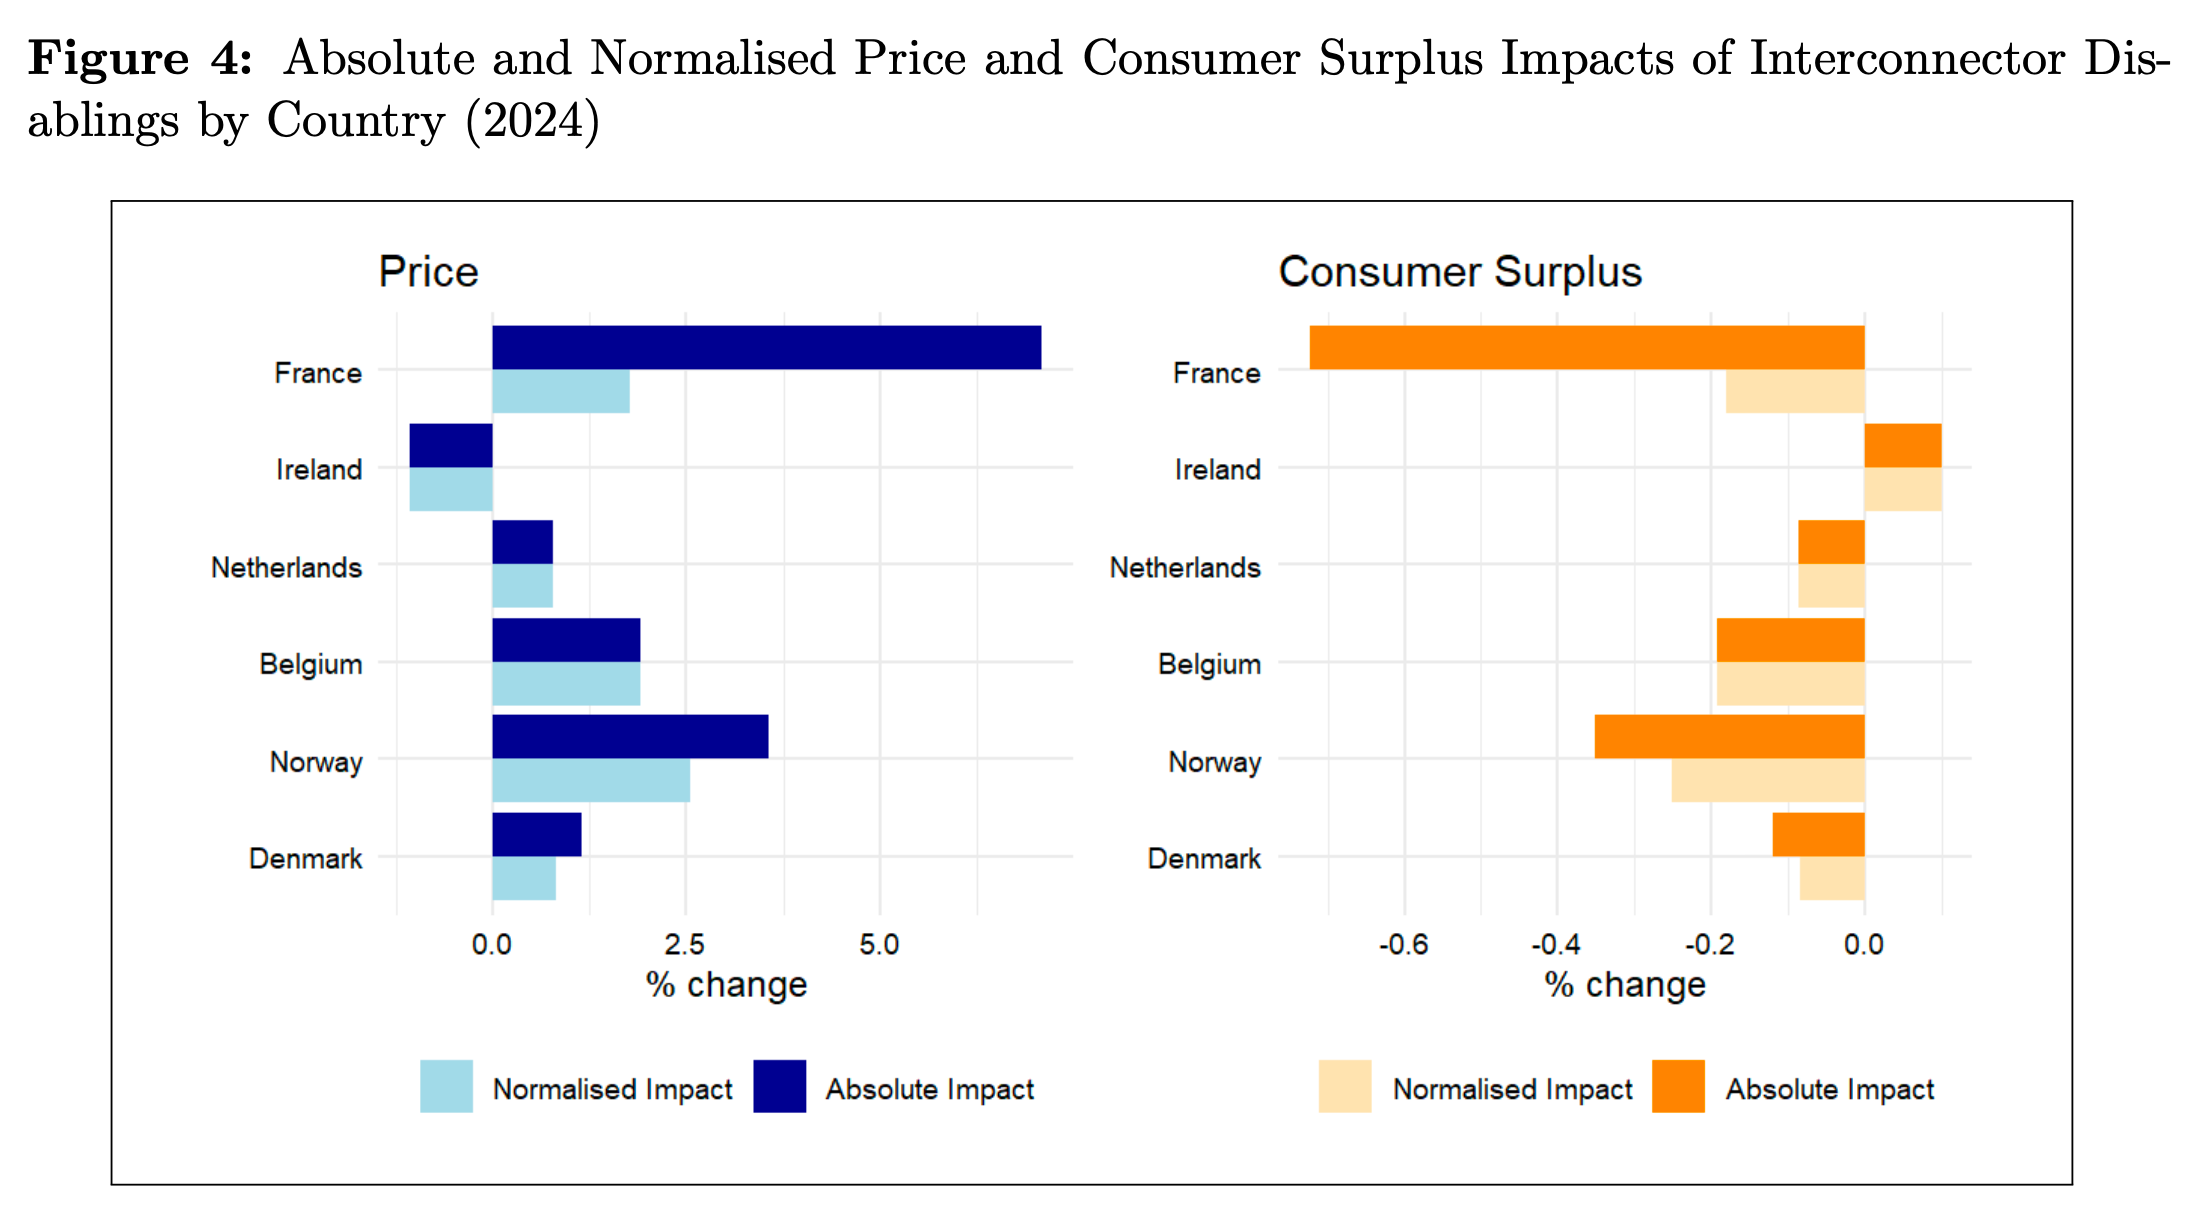
For all countries aside from Ireland, disabling interconnectors results in higher British wholesale prices and therefore lower consumer surplus. This is consistent with Britain being a net importer of less expensive electricity from European countries, and a net exporter to higher-priced Ireland.
On a country-by-country basis, our structural model findings are as follows:
Disabling France’s interconnectors has the largest absolute impact on prices, increasing them by 7.1%. When normalized by its 4 GW interconnector capacity, the impact reduces to 1.8%.
Norway has the largest normalized price impact, at 2.5%, reflecting its role as a low-cost supplier of hydroelectric power. Despite its smaller interconnector capacity compared to France (1.4 GW), the absolute price increase is significant at 3.6%.
Belgium’s interconnector also exerts a notable influence on prices, with both the absolute and normalized effects equal to 1.9%. This again aligns with the contribution of nuclear generation to its export supply.
Denmark and the Netherlands exhibit smaller impacts on British prices — 1.2% (absolute) and 0.8% (normalized) for Denmark, and 0.8% (absolute and normalized) for the Netherlands. This suggests more modest price differentials or more limited arbitrage opportunities under normal trading conditions.
Ireland is the only country where disabling its interconnectors reduces British prices — by 1.1% in both absolute and normalized terms. This is consistent with Britain typically being a net exporter to Ireland, therefore disabling this link reduces export-driven price increases.
Figure 5 presents the absolute and normalized impacts of interconnector disablings on domestic emissions.
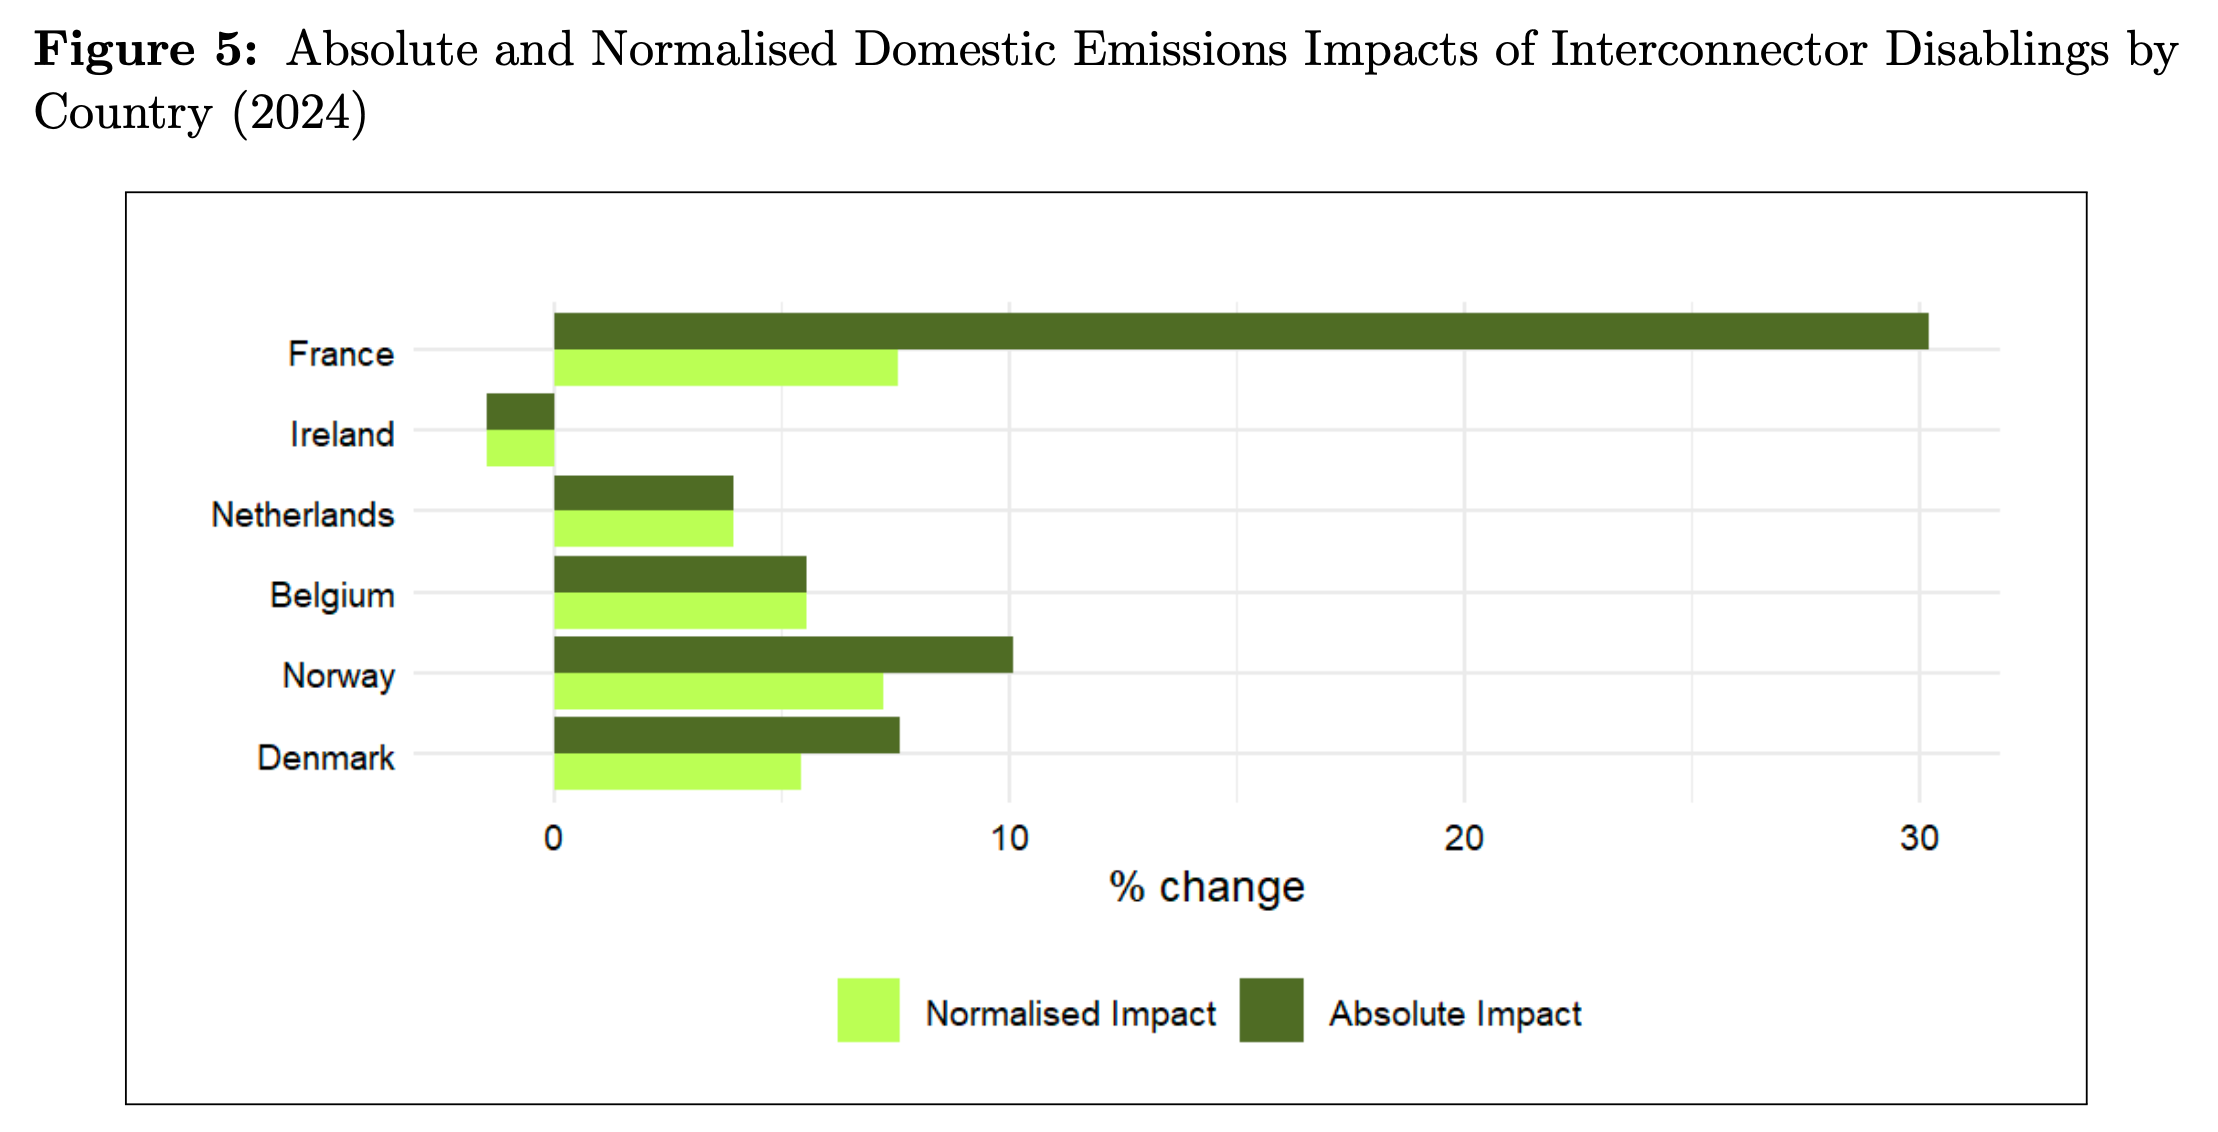
The results suggest a clear pattern:
Disabling interconnection with France causes the largest increase in domestic emissions, with a 30.2% absolute rise, and a 7.6% increase when normalized. This reflects displacement of low-carbon French nuclear imports with higher-emissions British gas generation.
Norway’s disconnection leads to the second-largest increase, with 10.1% absolute and 7.2% normalized rises in domestic emissions.
Denmark follows, with a 7.6% absolute and 5.4% normalized increase in domestic emissions.
Disabling the Belgium interconnector raises domestic emissions by 5.6%, both in absolute and normalized terms.
For the Netherlands, domestic emissions rise but slightly more modestly — by 4.0%, again equal in absolute and normalized terms.
Ireland is the only interconnector for which domestic emissions fall, by 1.5% in both absolute and normalized terms. This likely reflects Britain exporting less electricity to Ireland, thereby running fewer gas-fueled plants domestically.
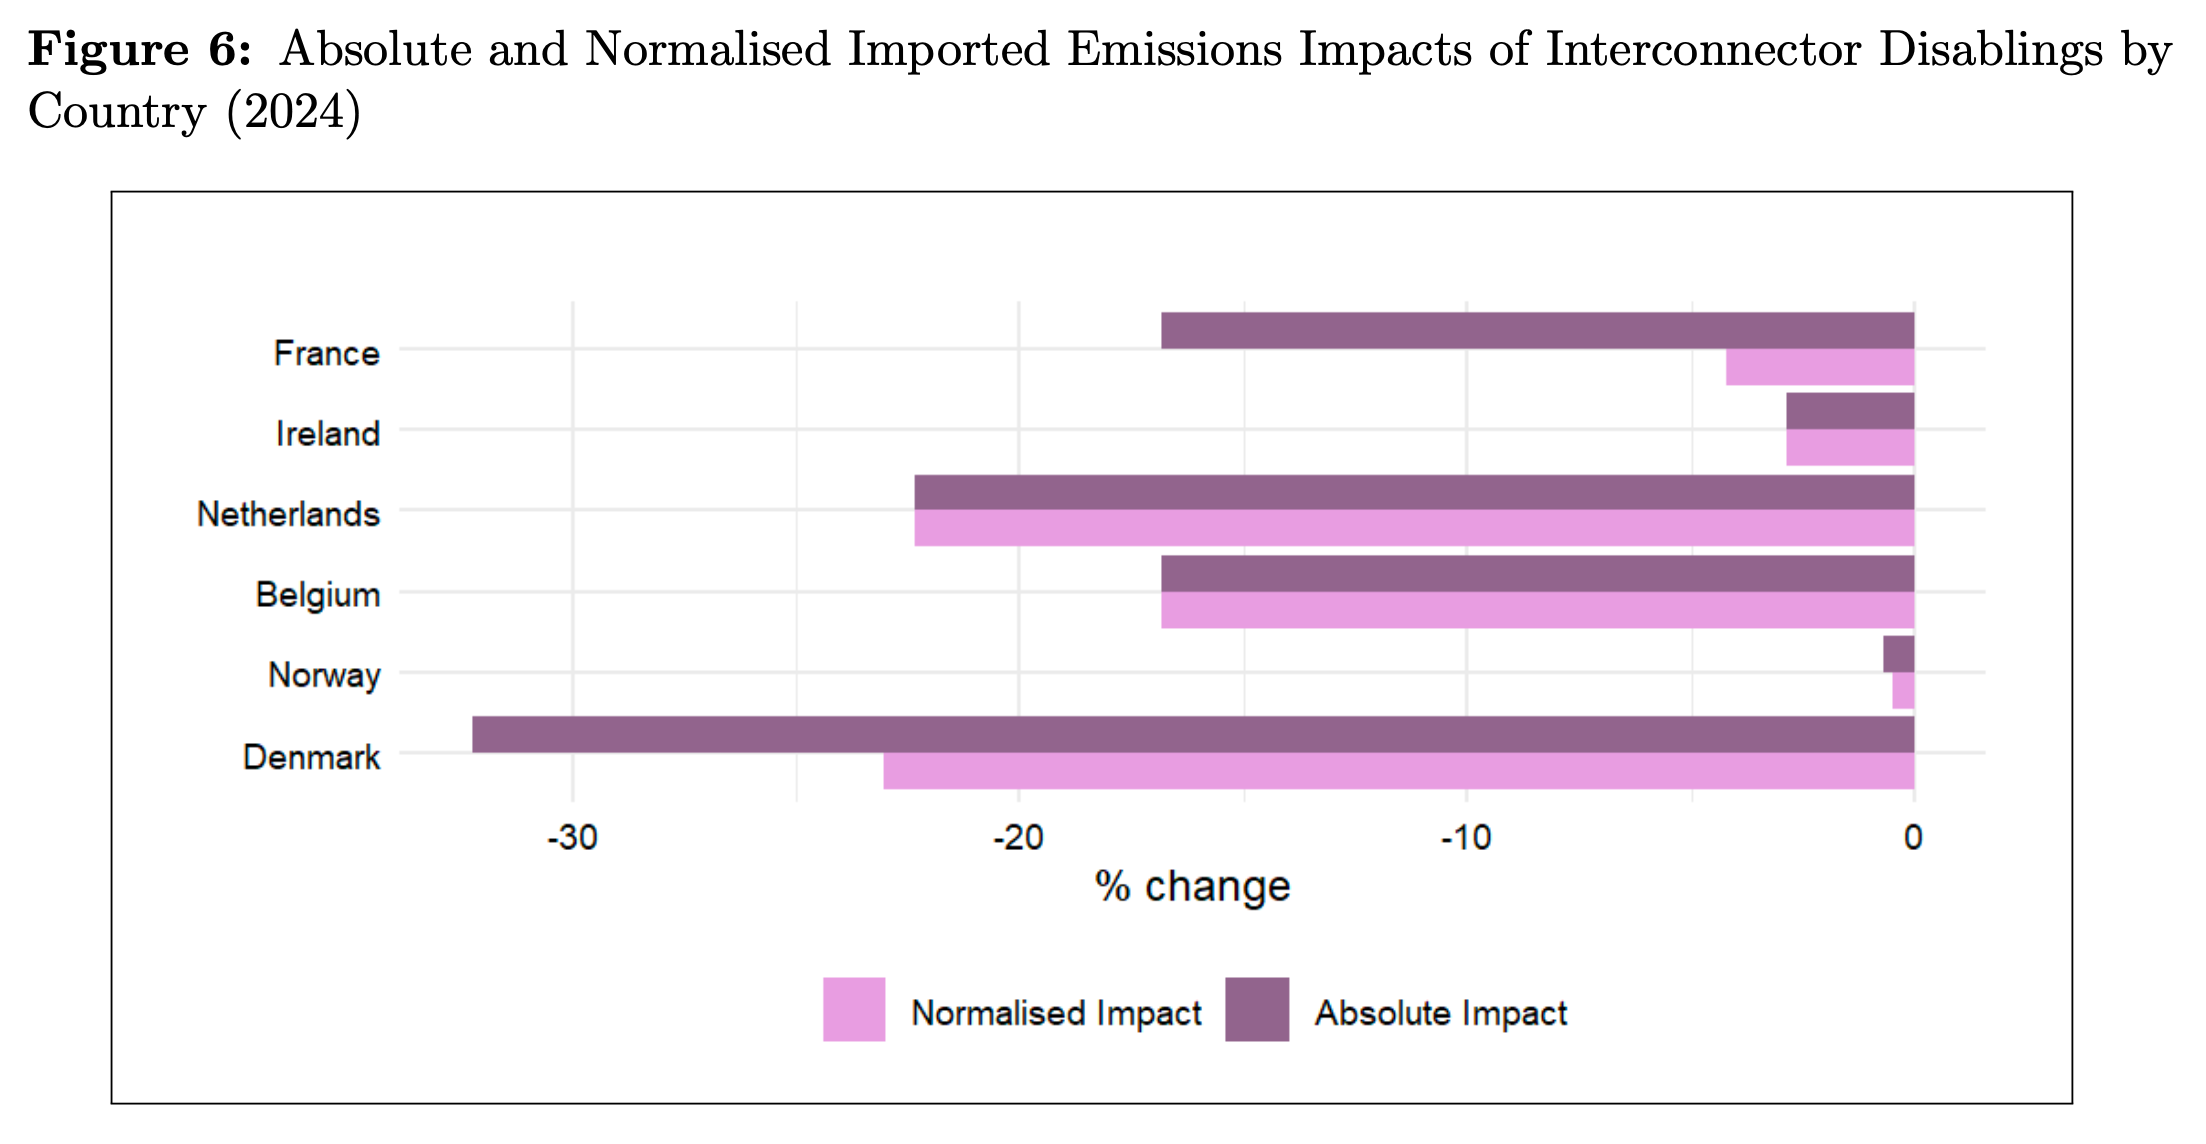
Figure 6 presents the absolute and normalized changes to imported and exported emissions following interconnector disablings. Disabling any interconnector reduces imported emissions, as Britain no longer receives electricity — and associated emissions — from the partner country.
Norway stands out as an exception: while imported emissions fall materially for all other countries, they only decrease marginally when the Norwegian interconnector is disabled. Denmark shows the largest reduction in imported emissions (32.2% absolute, 23.0% normalized), consistent with substantial volumes of carbon-intensive imports being displaced.
The arbitrage model
We noticed in our results that Britain and its trading partners don’t always trade in the direction that you would expect. Sometimes, even when prices were higher in Britain, Britain would export electricity to countries with lower prices. To better understand this, we implemented an alternative arbitrage model that removes the trading frictions observed in the historical data and assumes perfectly efficient cross-border trade.
This model ties interconnected flows directly to price differentials between Britain and the trading partner - if prices are higher in Britain, the model imports electricity until capacity is reached, and vice versa. This isolates how much of the baseline results stem from market inefficiencies like transmission congestion, contractual flows, or Brexit-related trading barriers.
Under the arbitrage specification, we found that across the majority of countries, the arbitrage-based model produces larger price increases when an interconnector is disabled. This suggests that in a more efficient market, Britain could increase consumer welfare by more heavily importing electricity to stabilize its prices, particularly from countries like France, Denmark, and Belgium. Notably, the price impact of losing access to French imports nearly doubles under the arbitrage assumption.
These results support the idea that price impacts are greater when interconnectors are traded via price arbitrage than under the more constrained conditions observed in reality - revealing the presence of trading inefficiencies in real-world cross-border electricity markets.
Investment model method and results
The investment model is an extension of the structural model to include endogenous investment in select technologies. The model thus chooses not only dispatch quantities and interconnector flows, but also is allowed to invest in domestic generation at will - still in an effort to reduce prices in Britain. These investable technologies include wind (on- and off-shore), solar, gas, and battery storage (2-hour duration).
Capital costs are represented with both linear and quadratic cost terms, the latter discouraging overbuilding and implicitly capturing siting constraints, system balancing costs, or policy preferences. Capital costs are annualized per MW and derived from DESNEZ and NREL using assumptions in line with industry standards. Any new capacity built by the model expands the available upper bounds for generation, charging/discharging power, and energy storage, and the rest of the model runs the same way as the non-arbitrage model, including the turn-one-off scenarios.
This analysis speaks directly to the second component of our hypothesis: that interconnectors and batteries may be substitutes in delivering grid flexibility, especially for a net importer like Britain.
In all cases, including the baseline scenario and every counterfactual, our model prefers to invest in battery storage capacity rather than any other technology. This finding is consistent across all capital cost assumption and model specifications. Because the social planner prefers batteries in every case, in effect, when comparing counterfactual outcomes to the baseline investment model, we are thus assessing the change in battery capacity required to compensate for the removal of each interconnection.
Figure 9 below presents the changes in battery capacity investment when each interconnection is disabled.
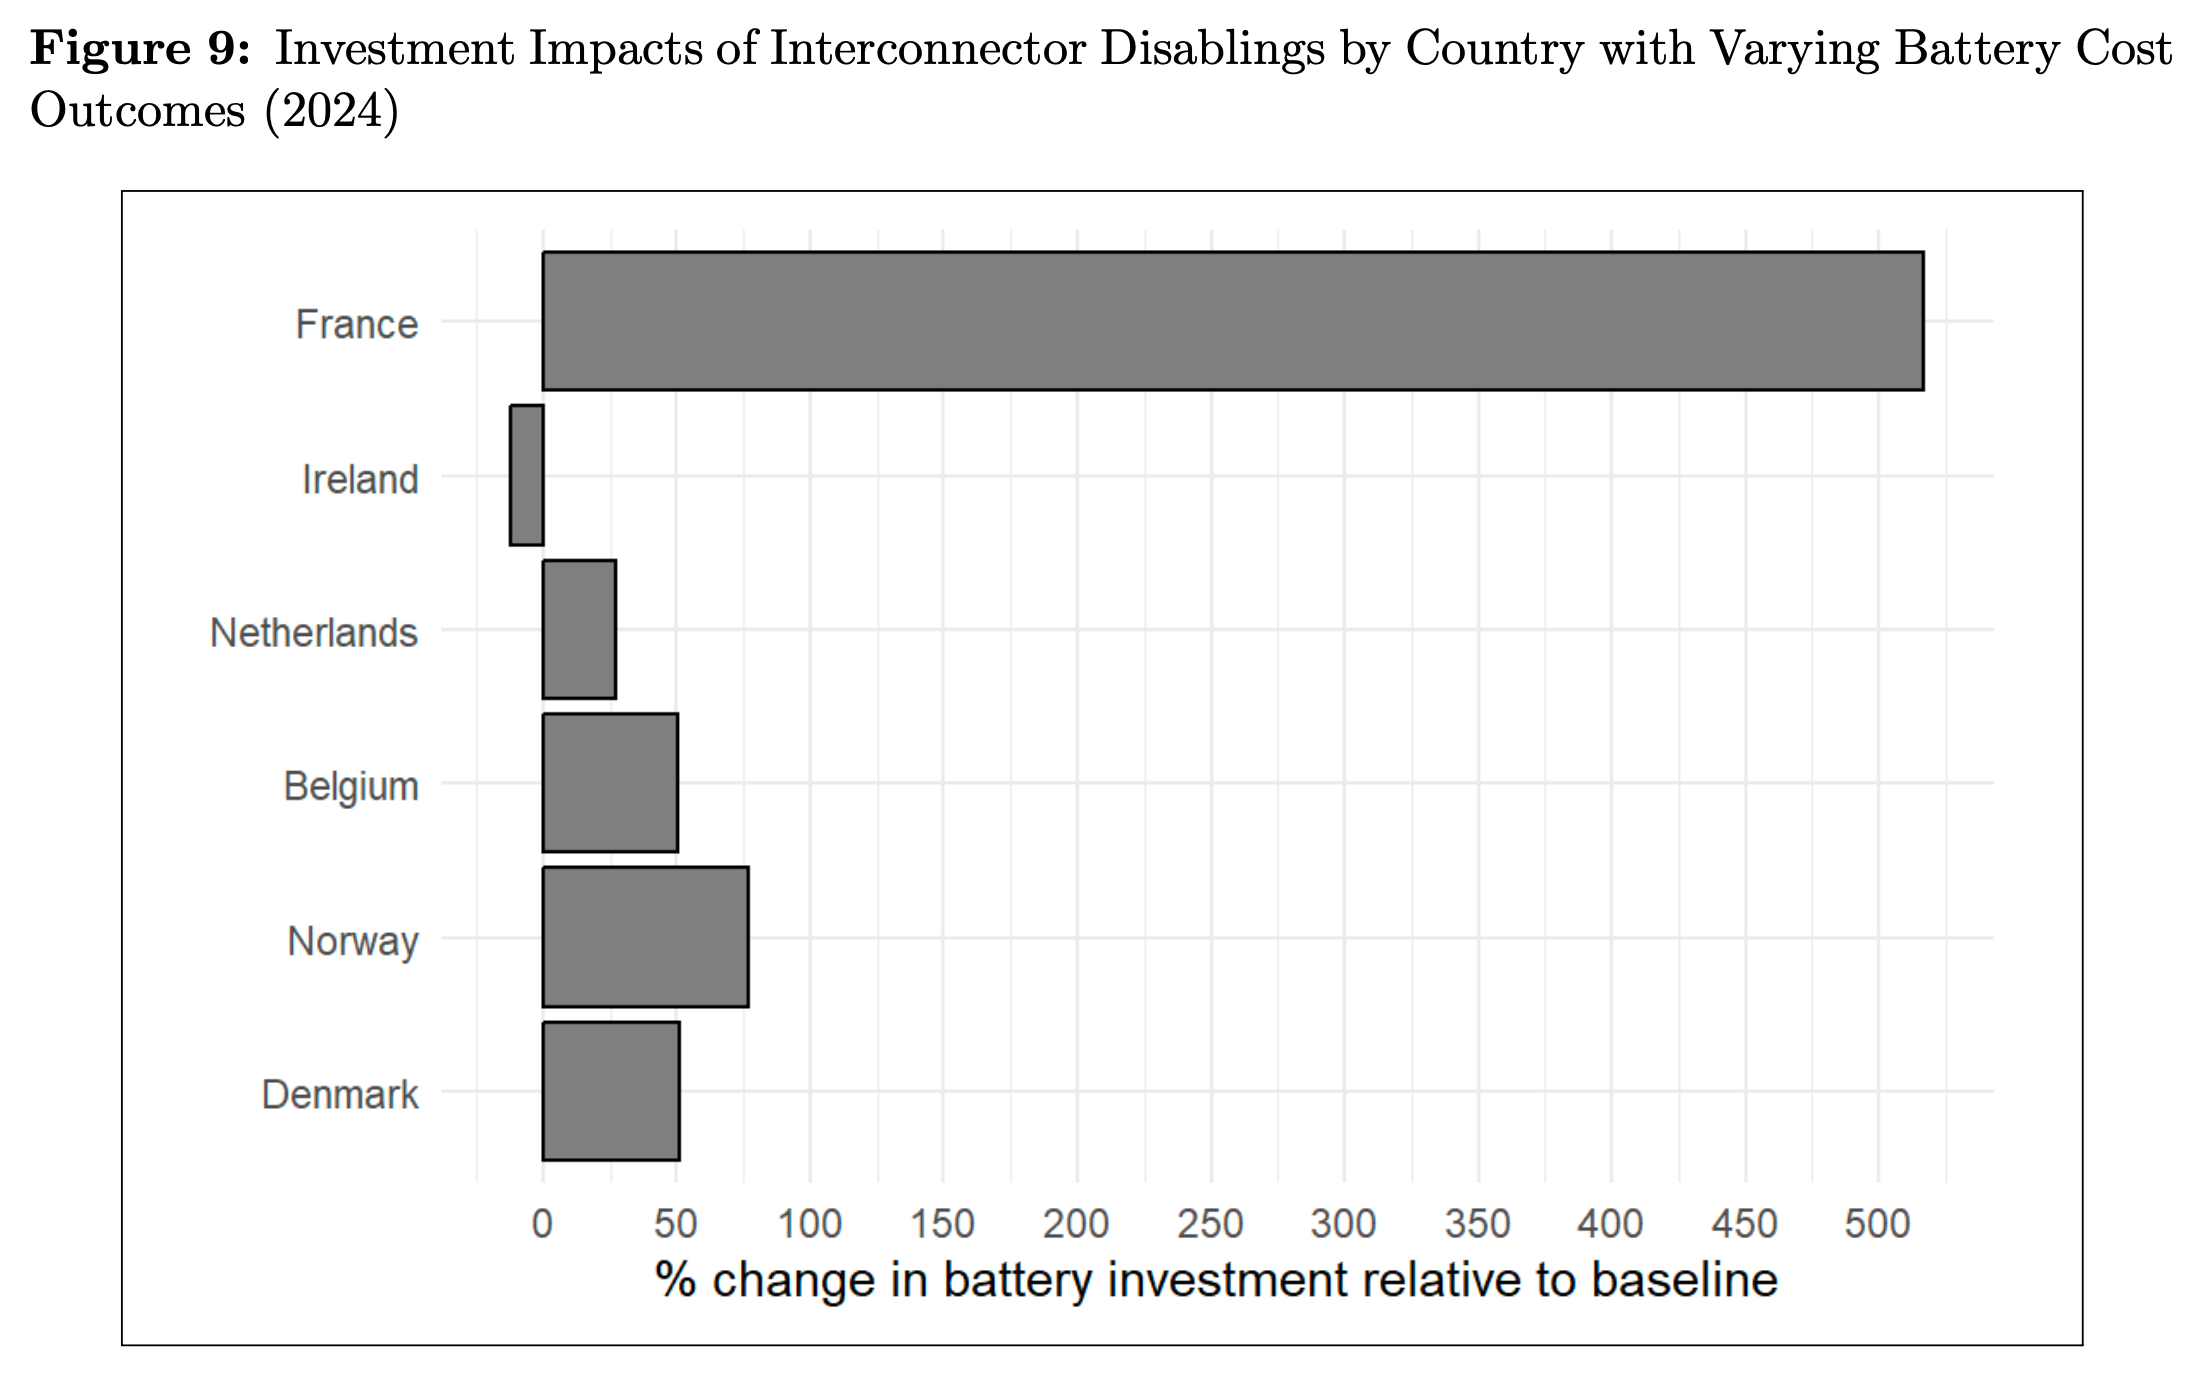
The results of the investment model follow a clear pattern:
For countries from which Britain is a net importer — including Belgium, France, the Netherlands, Norway, and Denmark — disabling interconnection increases battery investment. This indicates that, under net import conditions, interconnectors and batteries function as substitutes in delivering system flexibility.
The strongest substitution effect arises with France: when the 4 GW French interconnection is disabled, the social planner adds an additional 11 GW of battery power capacity above the 2.1 GW in the baseline scenario. Even when normalized, this remains the largest observed response, with 2.8 MW of battery investment per MW of interconnection lost. While this figure may appear disproportionate, it reflects the fact that this country’s interconnectors provide flows that are persistent across the majority of hours. To replicate this, the model builds sufficient battery capacity to store and discharge the equivalent of several hours of lost French imports.
For the country to which Britain is a net exporter (Ireland), battery investment is decreased in response to the disconnection. This suggests that, when net exporting, interconnectors and batteries act as complements — a finding consistent with the idea that export opportunities increase the marginal value of storage.
Given the uncertainty around battery capital costs and performance, we have sensitivity tested our results. In particular, we consider two sensitivities: (i) a “low battery cost model”; and (ii) the “high battery cost model.” In both cases, our qualitative results are unchanged: interconnectors and batteries appear to be substitutes when Britain is a net importer and complements when it is a net exporter.
The big take-aways
First, our results highlight the role of interconnection in reducing electricity prices and emissions in Great Britain. Across the reduced-form and structural models, we find strong evidence that interconnectors - particularly those with France, Norway, and Belgium - exert downward pressure on British wholesale prices. In the structural model, disconnecting the French interconnector increases prices by 7.1%, while the Norwegian link results in a 3.6% increase, despite its smaller capacity. When normalized by interconnector size, Norway has the greatest marginal value, reflecting the high value of imported hydroelectricity to Britain.
Crucially, we find the value of interconnection depends more on who Britain connects with than on simply expanding interconnector capacity. Links to low-cost, low-carbon partners provides far greater benefits than those to higher-cost or export-driven partners. This suggests that policy should prioritize high-quality interconnection over broad expansion of interconnection for its own sake.
Interconnectors also contribute to decarbonization, with interconnectors with France having the greatest impact. Disabling the French connection results in a 30.2% rise in domestic emissions. Norway and Denmark follow with sizable emissions increases, reinforcing the environmental value of low-carbon imports from these partners.
Our findings raise important questions around capacity utilization and investment planning. Interconnectors influence how domestic generation - especially gas-fueled generation - is used. When interconnectors are available, they suppress the marginal cost of electricity, displacing domestic generators. This implies that interconnection affects not just operating costs, but also investment incentives for domestic capacity.
Notably, falling battery storage costs offer both a complement and a substitute for interconnector investment. For a net importer like Britain, batteries currently act as substitutes by providing flexibility during import-constrained periods and helping to manage price volatility. Our investment model reinforces this point: across all scenarios the social planner consistently chooses to invest in battery storage over any other technology. This suggests that Britain’s current system challenge is less about expanding generation capacity and more about enhancing flexibility.
As Britain’s grid evolves and potentially transitions into a net-exporter of clean electricity, as per MacIver el al. (2021), batteries may increasingly act as complements to interconnection, enabling smoother export flows, storing surplus renewables, and improving the country’s ability to participate in international markets.
Policy frameworks have not kept pace with this shift in battery importance. Interconnection projects continue to receive strong regulatory support and partner transmission system operators, while battery investments remain largely private and face greater barriers. If batteries and interconnectors are indeed substitutes at the margin, as our results suggest, then current regulatory asymmetries risk misallocating investment and delaying decarbonization. A rebalancing of policy incentives — to more fully support storage alongside interconnection — may therefore be warranted as the system moves toward net zero.
I’d like to thank my really smart co-authors, Euan Gilchrist, Charles Nicholson, and Andrew Wells, for making this paper possible. You can find more detail on our data gathering, literature review, assumptions made, theory, model specifications, etc., in the full paper attached below.